


Reducing Consumable Costs in Washrooms: A Practical Guide
The popular advice is to buy the cheapest carton and negotiate harder next time. That approach misses where washroom costs usually accumulate. Reducing consumable costs in washrooms works better when operators measure effective uses, dispensing behaviour, waste, stock handling and service labour, rather than treating the invoice price as the whole decision.
A useful starting point is:
Purchase cost ÷ number of effective uses = approximate cost per use
The same logic can be applied at venue level:
Monthly washroom consumable spend ÷ relevant activity measure = consumable cost per customer, guest, occupied room or employee
A restaurant might use covers, accommodation may use occupied room nights, and a workplace may use staff attendance. Where reliable traffic counters exist, washroom visits provide an even more direct denominator.
Why Cheapest Carton Price Does Not Mean Lowest Washroom Cost
The lowest carton price can conceal short rolls, smaller sheets, poor dispensing and more frequent replacement. In a motel or hotel, a cheaper pack may look attractive until housekeeping removes partially used rolls during room resets, staff carry bulky cartons through the back of house, and the product delivers fewer usable metres than a denser alternative.
The practical comparison is not “which carton costs less?” It's “how much usable service does each carton deliver?” Roll length, sheet dimensions, dispenser compatibility and the amount left behind at replacement all affect that answer.
| Carton Option | Carton Price (NZD) | Metres per Carton | Cost per Metre (cents) |
|---|---|---|---|
| Illustrative Option A | $80 | 1,600 | 5.00 |
| Illustrative Option B | $95 | 2,200 | 4.32 |
These figures are illustrative only, not product specifications or customer results. Option B costs more at invoice level, but its approximate cost per metre is lower because the carton provides more usable paper.
Start with the operating denominator
A venue should choose an activity measure that reflects actual demand. A restaurant with changing service volumes may compare monthly spend with covers. An accommodation business may compare tissue and towel use with occupied room nights, while a workplace may use attendance.
Monthly purchasing alone can mislead. A larger order might reflect stock building, a delayed invoice or an emergency delivery rather than increased consumption.
Practical rule: A product decision is only as good as the denominator behind it.
NZ operators also need to account for freight and storage. Low-density cartons consume back-of-house space and may increase delivery frequency, while over-ordering can leave staff moving stock around unnecessarily. The issue becomes sharper during periods of price pressure. New Zealand reporting shows tissue and hygiene unit prices rose sharply in 2023, while retail tissue value sales increased again in 2024, making specification and purchasing discipline more important than a simple low-price strategy (New Zealand price indexes).
The same total-cost thinking applies beyond washroom supplies. Businesses reviewing honest pest control pricing can use a similar discipline, comparing the service delivered with the headline price rather than assuming a discount proves value.
For toilet tissue system choices, operators can also review how commercial toilet paper systems work. The governing lens remains cost per effective use, not carton price.
The Four High-Frequency Consumables That Drive Washroom Spend
Most hospitality washroom spend sits in four recurring groups: toilet tissue, paper towels, hand soap and ancillary items. Each needs a different comparison because the specification that sounds impressive on a product sheet isn't always the one that controls cost.
| Consumable | Spec That Drives Cost | Common Red Flag |
|---|---|---|
| Toilet tissue | Roll length, sheet dimensions and actual usable yield | Two-ply language masking a short roll |
| Paper towels | Sheets per pack, sheet size and sheets per hand dry | Carton price hiding low yield |
| Hand soap | Refill volume and dose per activation | Bulk refill feeding an uncalibrated pump |
| Bin liners and ancillary items | Liner gauge, dimensions and change frequency | Thin liners splitting and requiring replacement |
Toilet tissue
Sheet count matters, but roll length and sheet dimensions usually provide a clearer comparison between formats. Two products may both be described as two-ply while delivering different amounts of usable paper. Dispenser capacity also matters because a roll that runs out quickly creates more checks and more opportunities for an empty cubicle.
Staff should record how completely rolls are used before replacement. In accommodation, a partially used roll may be removed during a room reset for presentation reasons. That discarded remainder is a usage loss, even though the original purchase price stays unchanged.
Paper towels
For towels, the useful question is how many sheets are required for an effective hand dry. Folded towels, roll towels and controlled dispensing systems behave differently, so pack quantity alone doesn't tell the full story.
A carton containing more sheets isn't automatically cheaper if each hand dry takes several sheets. Sheet size, absorption, dispenser settings and user behaviour all need to be considered together. The commercial paper hand towel dispenser guide is relevant when matching format to traffic and maintenance routines.
Hand soap
Soap comparisons should start with refill volume and specified dose per activation. A large container may look economical, but an over-generous pump can turn each wash into an expensive dose. Conversely, an under-dosed dispenser can encourage double pumping, which removes the expected saving.
Soap availability also affects hygiene. A New Zealand public-toilet survey found soap was absent in 14.8% of facilities overall, with absence higher in the convenience sample than in the three-council sample, 21.5% versus 9.6%, with RR=2.23, 95% CI 1.37–3.64, p=0.0011 (New Zealand public-toilet survey). The operational lesson is straightforward: standardise soap provision before trying to reduce the amount available.
Ancillary items
Bin liners, hand sanitiser and toilet seat wipes can be smaller lines individually, but frequent changes still accumulate. Liner gauge matters because a bag that splits creates a second liner, extra cleaning and more disposal handling. A slightly stronger specification can be cheaper in use if it prevents avoidable replacement.
The SKOPE Open Deck Display Fridge, Black, OD460N is a chilled merchandising unit rather than a washroom consumable, with an open deck, no doors, a 1°C to 5°C operating range, adjustable shelving and a black powdercoat galvanised steel cabinet. It doesn't belong in a washroom cost calculation, but it illustrates a broader purchasing point: equipment and recurring consumables need to be assessed against how they function in the workflow, not just how their headline specification reads.
For facilities cleaning support, operators can also compare requirements with resources that browse Fort Worth office cleaning supplies, while keeping NZ site conditions, product availability and local compliance requirements central to the final decision.
Treating the Dispenser and Refill as One System
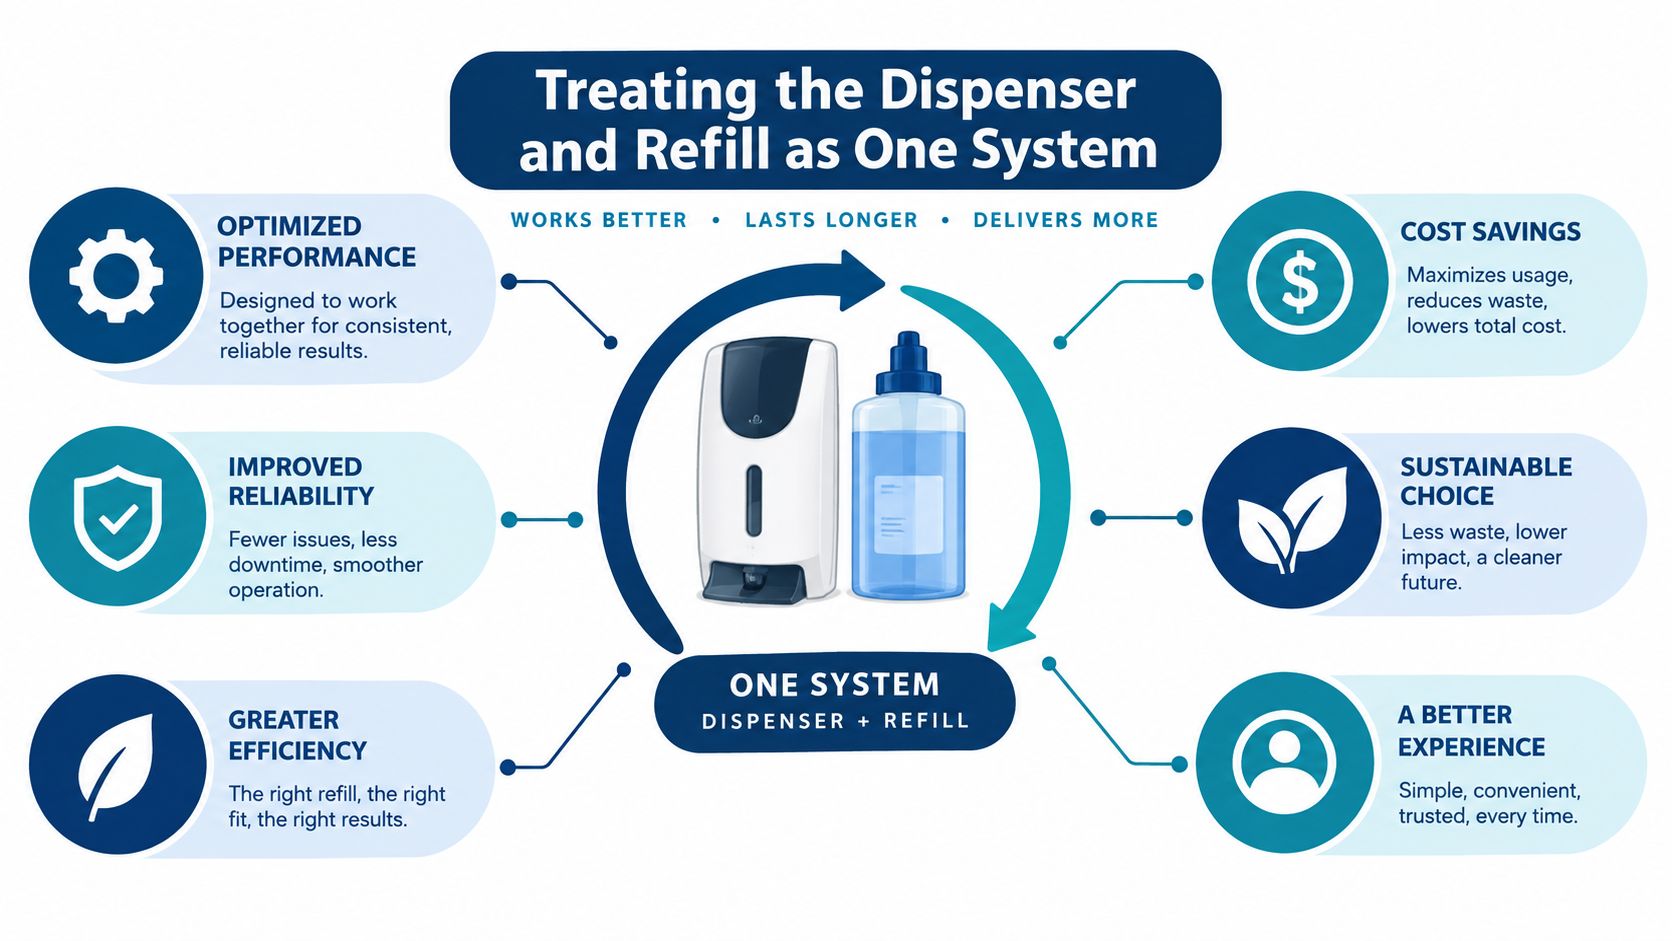
A refill and its dispenser should be specified together. A low-priced refill can become expensive if the dispenser allows users to pull several sheets, dispenses too much soap, jams often or needs frequent staff attention.
The practical system equation is:
Refill price + yield + dispensing behaviour + refill labour + waste = practical system cost
Four variables deserve attention:
- Refill price and yield: Compare the cost of a carton with the number of effective doses, sheets or hand dries it provides.
- Dispensing behaviour: Check whether users receive a controlled amount or can pull, pump or tear freely.
- Maintenance workload: Include refilling, clearing jams, cleaning leaks and retrieving stock.
- Waste at changeover: Record paper left on rolls, damaged packs and product discarded during resets.
Compare the operating result
Consider two illustrative paper-towel systems:
| System | Carton Price | Effective Hand Dries | Product Cost per Dry |
|---|---|---|---|
| Option A | $80 | 2,000 | 4.00 cents |
| Option B | $95 | 3,000 | 3.17 cents |
Option B has the higher carton price but the lower illustrative cost per dry. If its dispenser also presents one controlled towel at a time, it may perform better than the calculation suggests. That conclusion still needs measurement because user behaviour and dispenser condition can change the result.
Tork states that single-sheet dispensing can reduce paper consumption by up to 40%, a manufacturer claim that should be treated as system-specific rather than assumed for every dispenser or venue. The claim demonstrates why dispensing format belongs in the buying conversation, but it doesn't replace a site measurement.
NZ government procurement guidance also indicates that washroom consumables are often supplied with free-on-loan dispensers and delivery included, subject to minimum-order rules. Those terms can alter total cost, especially for multi-site operators comparing supplier arrangements.
A dispenser upgrade is therefore more than a capital purchase. It changes refill yield, staff routines, stock requirements and the amount of product users can access at once. Operators should check compatibility, refill availability, vandal resistance, cleaning access and whether staff can service the unit without creating a queue or an empty dispenser.
For soap-system details, the New Zealand antibacterial soap guide can sit alongside the product specification. The important test remains dose consistency and reliable availability, not the size of the refill alone.
Cost Per Use and Payback Calculations in Practice
Cost per use is the useful figure when comparing washroom systems. Start with the refill price, divide it by the number of effective doses or sheets, then test the result against actual venue activity. A spreadsheet is enough.
A soap-dose comparison
Take a soap refill priced at $24. At a calibrated dose of 1 millilitre, it provides 2,000 doses, costing 1.2 cents per use. The same refill set to 1.5 millilitres provides about 1,333 doses, raising the cost to approximately 1.8 cents per use.
At 300 uses per day over 365 days, the lower-dose setting produces 109,500 annual uses. The difference is about 0.6 cents per use, or approximately $657 per year. Those figures are illustrative only. A site should confirm the actual dose, refill yield and user volume before treating the result as a forecast.
A dispenser that has never been recalibrated can quietly erase the saving. Check pump settings, partial refills and soap left in discarded cartridges. A smaller dose is only useful if it still delivers adequate coverage and users do not compensate by pumping twice.
Include labour in the system comparison
The refill price is one part of the system. Staff time can be affected by roll changes, retrieving cartons, clearing jams, cleaning leaks and responding to empty dispensers. Record that labour locally rather than assuming it is insignificant.
A dispenser conversion can be tested with this formula:
Dispenser conversion cost ÷ monthly consumable saving = approximate payback period
For example:
- Current consumable spend: $500 per month
- New system spend: $400 per month
- Monthly saving: $100
- Dispenser conversion cost: $600
- Approximate simple payback: $600 ÷ $100 = 6 months
After payback, the saving can continue if usage remains lower and the equipment stays reliable. Include installation, servicing, staff training, disposal and minimum-order conditions before approving the change. Ask your supplier whether free-on-loan dispensers and included delivery depend on minimum orders, because those terms change total cost.
Match the calculation to the venue
A motel may compare product spend with occupied room nights. A mid-tier hotel may separate guest rooms, public facilities and conference areas. A restaurant may compare washroom use with covers, while a bar with irregular peaks may use direct traffic counts where available.
State the assumptions clearly: what counts as an effective use, whether purchased stock was consumed, how waste was recorded and whether venue activity remained broadly comparable. That discipline prevents false precision and exposes whether the saving came from better dispensing or only lower occupancy.
A Simple KPI Framework to Track Washroom Consumables
A useful KPI set is small enough for an operations manager to maintain and detailed enough to expose waste. The figures can live in a spreadsheet, a point-of-sale export or a supplier portal.
| KPI | Basic formula | Main data source | Review owner |
|---|---|---|---|
| Units purchased | Packs, rolls or refills received | Invoices and delivery records | Purchasing |
| Monthly spend | Supplier charges for the period | Accounts payable | Finance or operations |
| Cost per use | Spend divided by effective uses | Usage log and activity data | Operations |
| Stock on hand | Opening stock plus receipts minus issued stock | Store count | Duty manager |
| Emergency replenishments | Number of unplanned top-up events | Delivery and incident records | Facilities or housekeeping |
Each measure catches something different. Spend detects price changes, units highlight purchasing volume, cost per use shows efficiency, stock on hand exposes over-ordering or shortage risk, and emergency replenishments reveal weak forecasting.
Normalise against business activity
Total spend can rise because the business is busier. If washroom spending rises 15% while customer numbers rise 25%, the operation may have become more efficient per customer, provided those figures are measured consistently. Conversely, flat spending isn't necessarily positive if customer numbers have fallen substantially.
For accommodation, the denominator could be occupied room nights. For restaurants, covers may be appropriate. For workplaces, staff attendance may be more useful. Where washroom visits are available, they can provide a closer link to actual consumption.
A rolling period can make the trend easier to interpret than one isolated month. A three-month view, or another sensible period suited to seasonality, helps separate a genuine dispensing issue from a busy event, delayed invoice or stock build.
Set action questions
The framework should trigger questions rather than produce reports for their own sake:
- Spend changes: Has supplier pricing or the product specification changed?
- Cost per activity rises: Is product being over-dispensed, wasted or replaced early?
- Stock falls quickly: Has demand increased, or is the store issue process uncontrolled?
- Emergency orders appear: Is the reorder point too low, or is stock being held at the wrong site?
- Units rise without activity growth: Is a dispenser, leak, breakage or user habit driving excess use?
New Zealand public-sector purchasing shows why scale matters. DOC ordered 15.5 million metres of toilet paper across its 2024/2025 period, according to a recent NZ commercial washroom guide (NZ commercial washroom guidance). That figure isn't a benchmark for hospitality, but it illustrates why consumption data can reveal the effect of small repeated changes.
Where Cost Reduction Goes Too Far
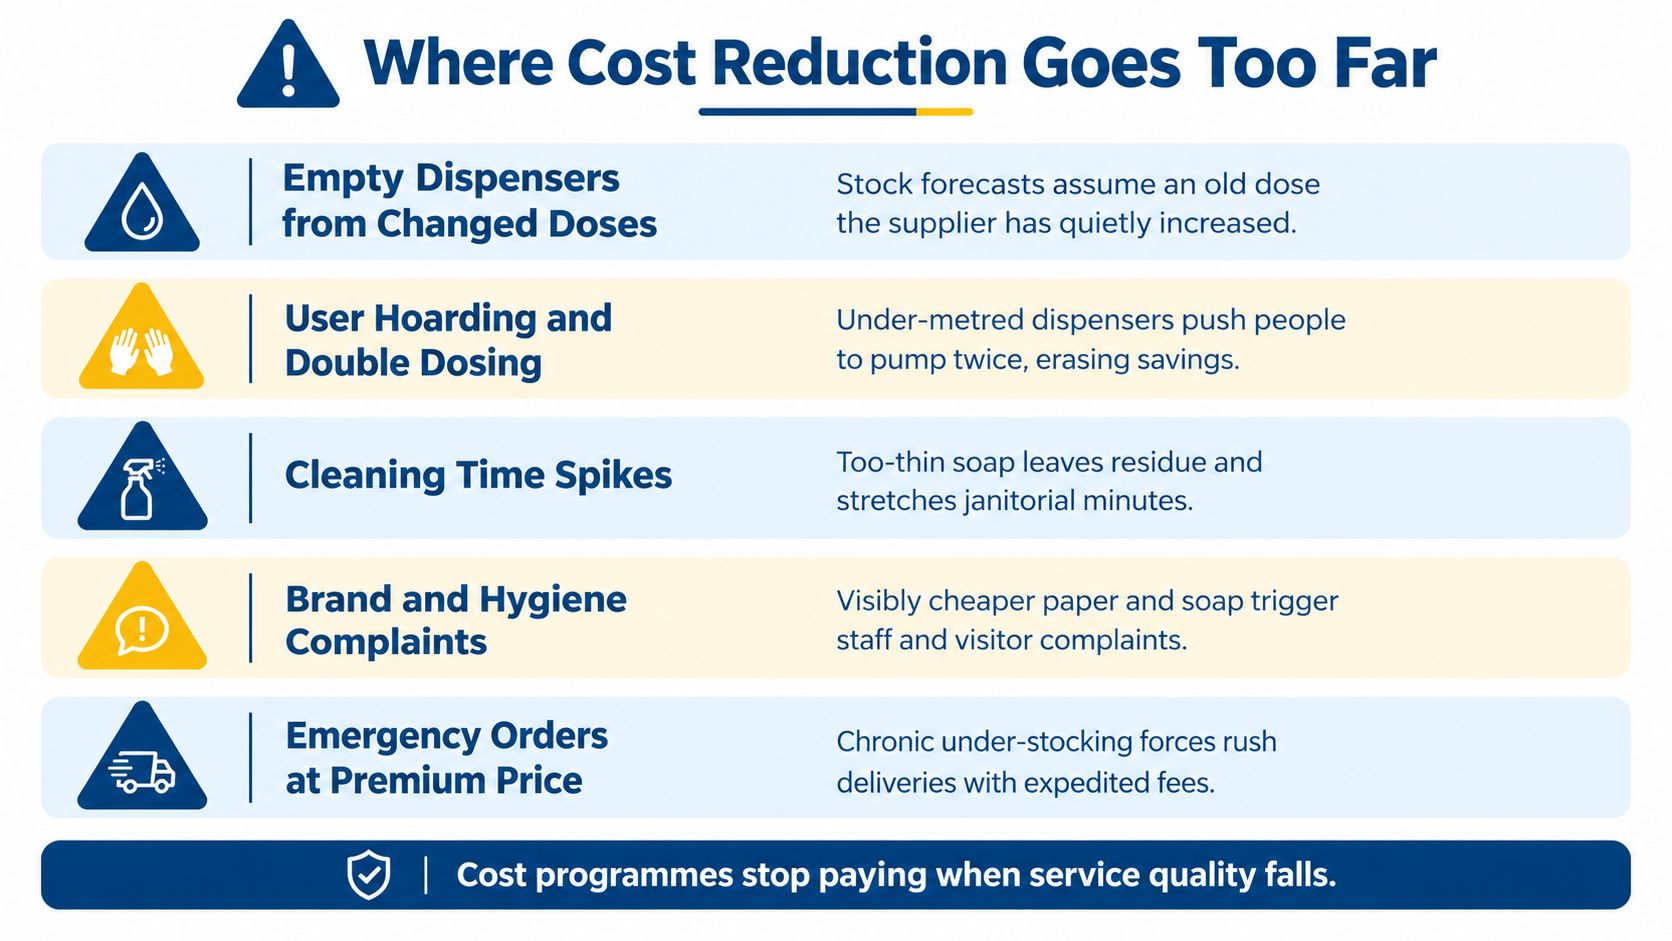
Cost control stops working when the guest, staff member or cleaner has to compensate for it. Empty dispensers, poor paper and unreliable soap create service failures that don't appear in a purchasing report.
The first warning sign is a dispenser that runs out before the next scheduled check. A dose change, altered sheet count or new refill format can invalidate an old stock forecast. Staff then make urgent trips, borrow stock from another area or leave the washroom below standard.
A second sign is repeat use. If a soap dose is too small, users may pump twice. If a paper towel is too narrow or thin for the task, users may take several sheets. The lower unit price becomes irrelevant when the effective use rate rises.
Protect hygiene and workflow
A New Zealand hand-hygiene study found that 86.7% of people washed their hands, and 91.2% of those who washed also dried them, but median wash time was 8.6 seconds and median paper-towel drying time was 7.9 seconds, both below the recommended 20 seconds for each step (New Zealand hand-hygiene study). The operational response shouldn't be to restrict supply. It should be to use controlled-dose dispensing, provide suitable drying capacity and reinforce behaviour with clear signage.
Warning signs include:
- Empty dispensers: Stock forecasts no longer match actual dose or traffic.
- Skin or hygiene complaints: The soap or paper is unsuitable for regular use.
- More cleaning time: Leaks, jams and poor-quality liners add work.
- Accessibility problems: A dispenser is difficult to reach, operate or understand.
- Wastewater risk: Non-paper items are being flushed or entering the drainage system.
Water NZ has warned that flushing wipes rather than only toilet paper has cost New Zealand wastewater utilities at least NZ$16 million a year in pipe unblocking (NZ washroom consumables and wastewater guidance). For hotels, restaurants, marae, schools, hospitals and aged-care facilities, clear signage and suitable paper products are cost-control measures as well as user education.
Service standard: Remove unnecessary consumption, not necessary consumption.
Before changing a product or dispenser, operators should verify the dose, test the refill on the existing unit, check staff feedback, review guest comments and confirm that waste and drainage requirements remain suitable. A low-cost system that creates constant checking, complaints or emergency ordering hasn't delivered a real saving.
Cleaning chemistry deserves the same care. The relevant toilet bowl cleaner guidance can help operators assess product suitability alongside the washroom consumables themselves.
Why Frequency Magnifies Small Washroom Purchasing Decisions
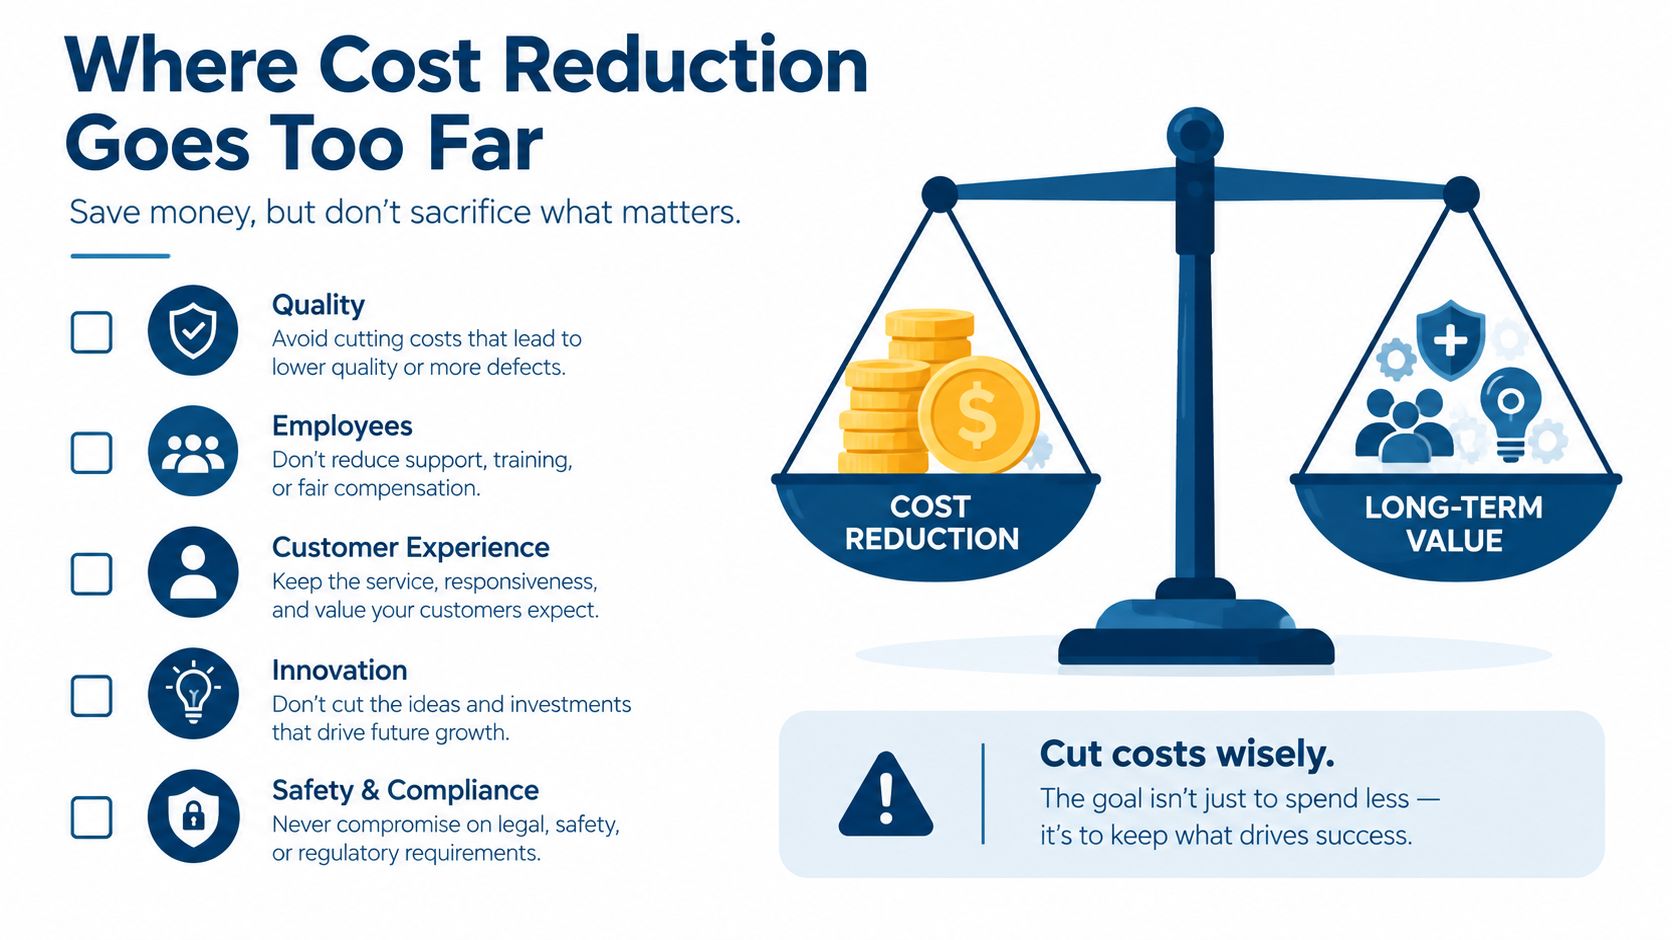
A one-off price difference behaves differently from a recurring usage difference. Paying an extra $20 once adds $20. A small difference in cost per use repeats through every hand dry, tissue issue, soap dose and bin-liner change.
That principle applies across venue types. A motel, hotel, restaurant, bar, workplace or public facility may have very different traffic patterns, but each needs a denominator that reflects its own activity. A busy period can make total spend look worse while cost per customer improves, so purchasing decisions should be based on normalised usage rather than a single invoice total.
Turn data into a supplier conversation
An account review should cover more than carton pricing. Operators can ask suppliers to compare:
- Product yield: Roll length, sheet count, refill volume and effective uses.
- Dispenser format: Controlled dispensing, capacity and refill compatibility.
- Delivery terms: Freight, minimum orders and the practicality of consolidated deliveries.
- Stock mix: Whether multiple sites can use the same specification without creating excess inventory.
- Usage evidence: Purchase quantities, waste records and emergency replenishment history.
A broader cleaning routine can support the same discipline. The cleaning programmes for cafés resource is relevant where consumable control needs to sit alongside staff workflow and hygiene checks.
The washroom is rarely the largest operating line, but it's an accessible place to build better procurement habits. Measure effective use, connect the dispenser to the refill, normalise against activity and review the system before changing the product.
Simply Hospitality supplies commercial washroom consumables, cleaning chemicals, disposables and related hospitality equipment for New Zealand businesses. Operators can use Simply Hospitality to review suitable product categories, compare specifications and request help matching tissue, towels, soap and dispensing systems to venue traffic and maintenance routines.