

How Much Does Poor Kitchen Workflow Cost Every Shift?
Poor kitchen workflow costs money every shift, even when nothing seems to go wrong. Your team gets paid for time spent walking, hunting for tools and waiting on the fryer. In a hypothetical four-person kitchen, 12 minutes of avoidable delay per person works out to about $25.60 of staff time lost each shift at an illustrative $32 per hour. When service drags, the damage can spread to lost sales and wasted food.
Why Kitchen Workflow Has a Financial Cost
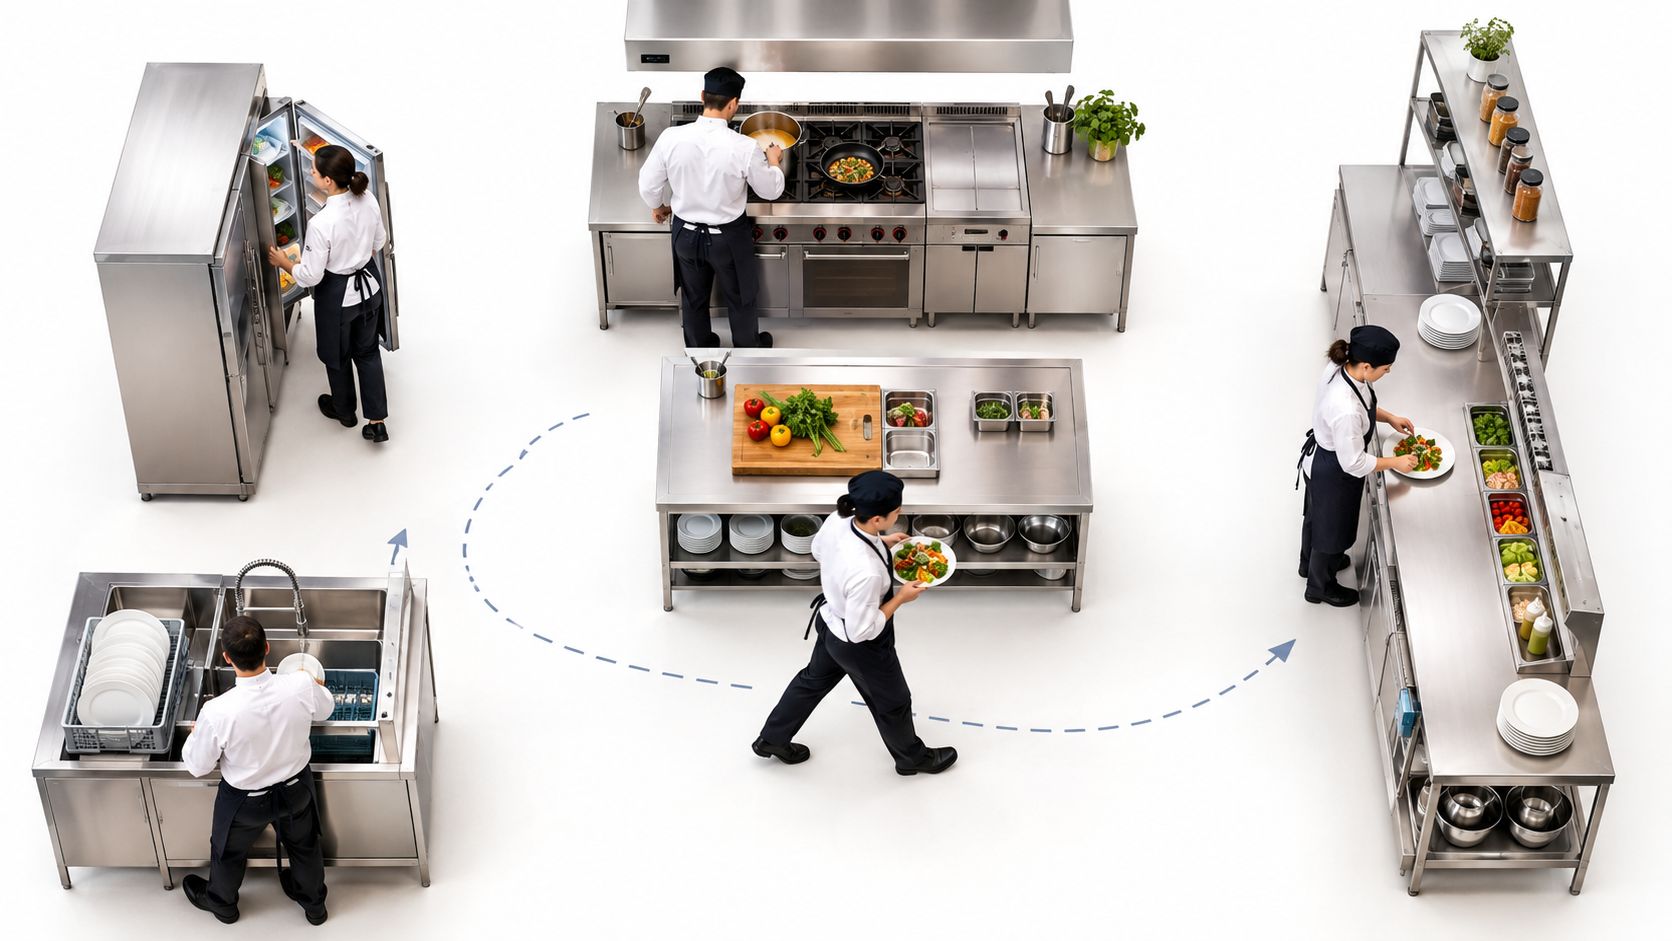
Picture your kitchen as a relay team. Each plate gets handed from one station to the next, and every extra step is time nobody gets back. A couple of seconds lost at each handover doesn't feel like much, but multiply it across a full service and it becomes real money.
Where the Money Leaks Away
Layout, equipment placement, prep routines and the way people move through the room all affect how quickly the kitchen runs. When any of these work against the team, the cost appears as paid time that produces nothing.
Some of the most common culprits are:
- Walking back and forth between workstations
- Searching for utensils or ingredients
- Waiting for shared equipment to free up
- Moving food or cookware more often than necessary
- Crowded prep benches
- Fridges placed far from where they're needed
- Slow or disorganised dishwashing
- Repeating tasks because nothing has a fixed home
Peak service makes all of this worse. Delays stack up across tickets, so one slow fryer or cramped bench can hold back the whole brigade, not just the person standing in line.
Quick Answer: Illustrative Value of Lost Staff Time Per Shift
Wasted minutes can look harmless on their own, so it helps to put a number on them. The table below uses hypothetical figures for calculation purposes only. They are not industry benchmarks.
| Team scenario | Minutes wasted per person | Fully loaded hourly cost | Value of time lost per shift |
|---|---|---|---|
| Four-person kitchen | 12 | $32 | $25.60 |
| Three-person café | 10 | $30 | $15.00 |
A $25.60 loss in one shift may not worry you. Repeat it every day for a month, though, and the total starts to look very different. That's why small leaks are so easy to ignore and so expensive to keep.
Workflow Problems Versus Equipment Limits
Workflow problems come down to how people and food move. Equipment limits are about capacity, like an oven that's simply too small for the menu. The two often overlap. A cramped layout can make a modest oven feel even smaller than it really is.
A workflow problem is often mistaken for an equipment problem. Before spending on new gear, check whether the team is losing time to movement and searching first.
Cash flow feels the effect of these hidden costs too. If you want more context on the financial side, this EndureGo Tax cash flow advice guide is a useful read.
For layout principles that save time on every service, take a look at our Commercial Kitchen Workflow article.
Calculate the Cost of Wasted Minutes Per Shift
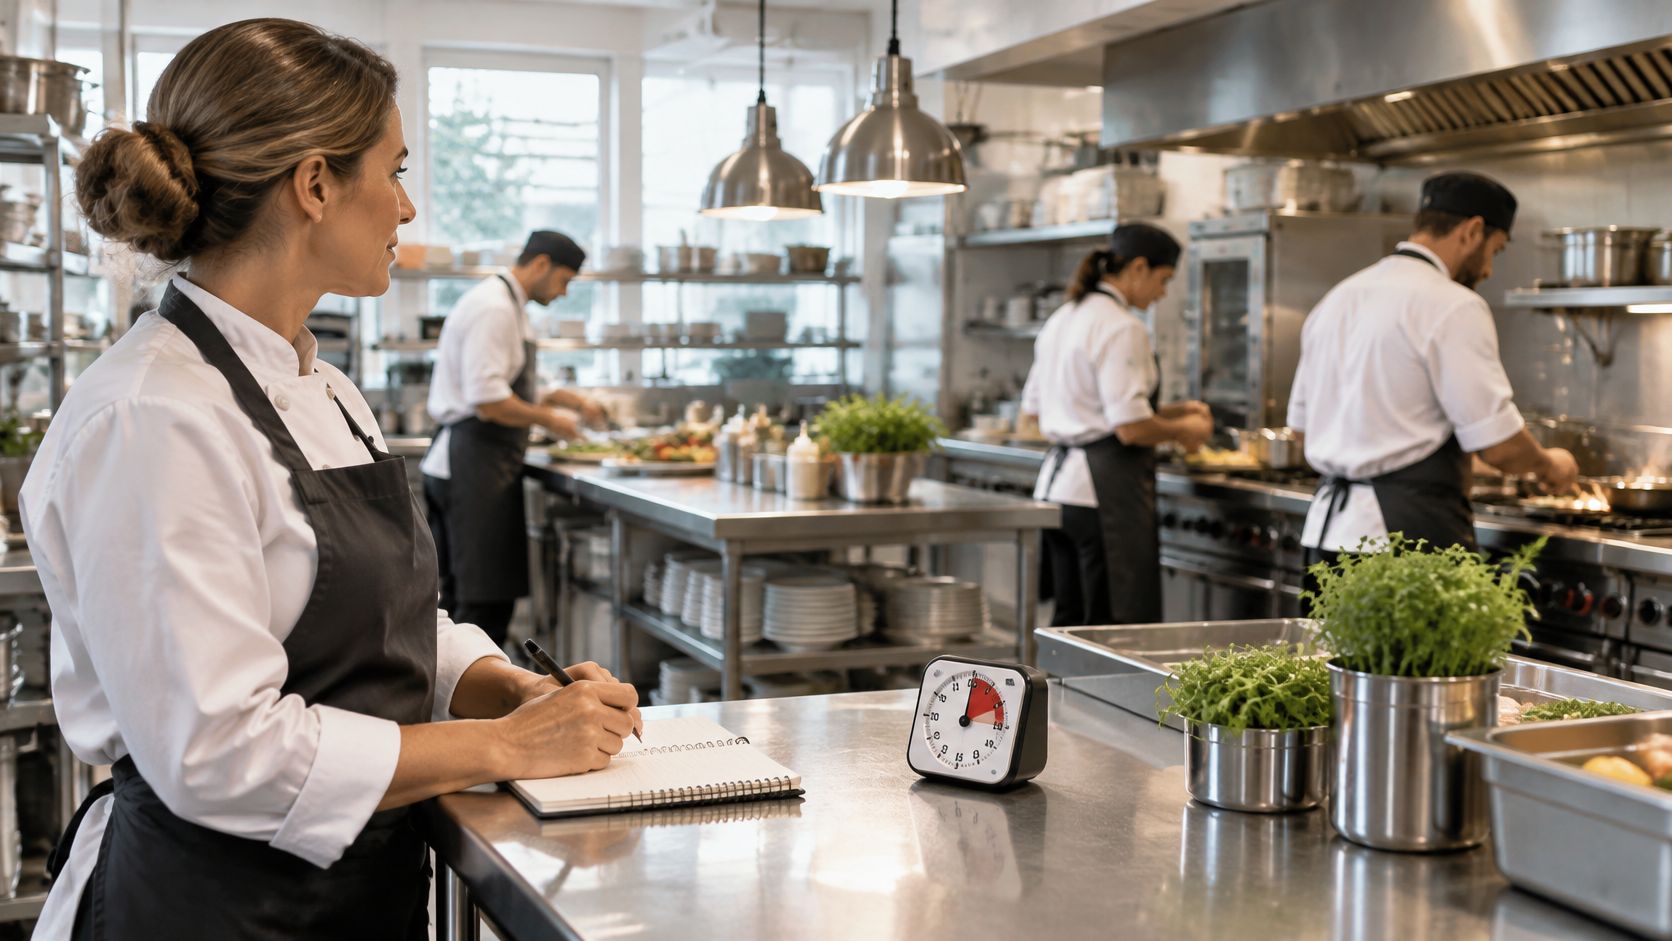
Once you can spot the small delays, the next job is putting a dollar value on them. It's less complicated than most people expect. You only need a timer, a rough headcount and your hourly labour cost.
The Core Formula
Minutes wasted per employee × number of employees ÷ 60 × hourly employment cost = value of time lost per shift
Let's test it in a hypothetical New Zealand kitchen. Four staff members each lose 12 minutes a shift to avoidable movement and delays. Think long walks to a distant fridge, or standing around waiting for a shared oven to free up.
Working Through the Example
Say the fully loaded employment cost is an illustrative $32 per hour. The working goes like this:
- Combined wasted time: 4 staff × 12 minutes = 48 minutes per shift
- Value of lost time: 48 ÷ 60 × $32 = $25.60 per shift
- Across 300 operating shifts: $25.60 × 300 = $7,680 per year
What the Figure Really Means
It's worth being clear about what that number represents. The $25.60 is time that could be recovered. It isn't cash that lands in your bank account after each shift.
Real payroll savings only show up when paid hours, overtime or staffing needs actually drop. If the team still works the same rostered hours, that time simply gets spent somewhere else.
The $32 is a fully loaded rate, so it can cover more than the hourly wage. Depending on your setup, that might include leave, KiwiSaver contributions, training and insurance. It's a useful distinction to bring to your accountant or payroll provider.
Wage pressure is the reason this matters. Labour is often one of the largest costs in a hospitality business, so a few minutes per person add up faster than you'd think. You can read the full research about hospitality wage costs and labour pressures for broader context.
Scaling Down to a Two-Person Team
Think of it like a leaking tap. One drip is easy to ignore, but a steady drip runs all day and fills the bucket.
The same maths works for a smaller crew. Picture a two-person café where each person loses 6 minutes per shift at $30 per hour.
Combined, that's 12 minutes. 12 ÷ 60 × $30 = $6.00 per shift, or about $1,680 across 280 shifts a year.
My advice is to time the minutes rather than guess them. Guesses rarely match what a stopwatch shows, so track a few typical tasks during a busy service and see what turns up.
Common Mistakes When Counting Minutes
A few errors can throw the result off, so watch out for these:
- Counting only the obvious delays: Brief waits and extra steps add up too.
- Using one unusually busy service: Measure a representative shift, not a chaotic one.
- Forgetting the roster: Include the people who actually work the shift, casuals too.
- Using base wages only: Leave, KiwiSaver and insurance change the true hourly cost.
Once you have a per-shift figure, multiply it by your annual operating shifts to see the scale. Treat the result as a starting point rather than a final verdict. It also gives you a before-and-after measure once you start making changes.
If you want a closer look at one common source of lost time, read how manual food preparation adds to commercial kitchen costs.
Where Kitchen Time Gets Wasted and How to Spot It
Time leaks out of a kitchen in predictable places. Think of it like a dripping tap. One drip seems harmless, but left running all week, it wastes a lot of water. Most kitchen leaks are small enough to ignore, and that's exactly why they stick around.
Prep and Cooking Delays
Food preparation is usually where the first leak starts. When ingredients aren't organised by station, cooks end up repeating setup, reaching for containers and handling the same product twice. Nobody does this on purpose. It just becomes the way things are done.
Cooking delays tend to come down to waiting. A cook might stand beside a fryer or oven that's still busy, or queue for a shared workstation while tickets stack up above the pass.
Refrigeration and Plating Hiccups
Refrigeration problems are mostly about distance and disorder. A walk-in at the far end of the building can add dozens of trips per shift. Cold storage that isn't labelled means people searching every shelf, often with the door open and the cold air escaping.
Plating slows down when bench space is tight, the right tongs or spoons aren't within reach, or handovers between the line and the pass involve a lot of back-and-forth. Each small pause feels harmless on its own. Across a busy night, they add up to a surprising amount of standing around.
Dishwashing and Storage Gaps
Dishwashing is often the hidden bottleneck. Dirty dishes pile up when the machine is full or the process is slow, and before long, staff are stopping service to hunt for clean crockery.
Storage problems come down to location. When equipment and ingredients live away from where they're used, every task starts with a walk. A spare pan kept in the back store is a small delay, but it happens every single day.
Mapping Problems Against a Real Shift
The table below uses illustrative figures to show how small delays stack up. These aren't industry averages, so treat them as a starting point and swap in the numbers from your own kitchen.
Illustrative Workflow Problems and Their Time Cost
| Workflow problem | Time lost per occurrence | Frequency per shift | Potential improvement |
|---|---|---|---|
| Walk to distant fridge | 30 seconds | 40 times | Move high-use items closer to prep |
| Waiting for shared oven | 20 seconds | 60 times | Stagger tasks and schedule shared equipment |
| Searching for utensils | 15 seconds | 20 times | Give each tool a labelled home |
| Hunting for clean crockery | 45 seconds | 15 times | Set par levels and restock between rushes |
| Plating handovers | 10 seconds | 30 times | Position the pass and tools within one step |
| Ingredient retrieval from storage | 20 seconds | 25 times | Use one consistent storage location |
Look at the table with a critical eye. Most of these problems cost only seconds at a time, and that's the trap. Nothing on the list looks serious until you multiply it by the number of times it happens during a shift.
Why Small Delays Go Unnoticed
A 20 second wait repeated 60 times adds up to about 20 minutes of lost time. Nobody notices it in the moment, because each wait feels too brief to matter.
Common signs that small delays are building up include:
- Staff calling across the kitchen for items that should be within arm's reach
- Cooks walking back and forth to the same storage area during a single service
- Plates waiting at the pass while someone looks for a spoon
- Dish pile-ups that only seem to happen at the busiest times
Repeated minor delays are rarely isolated. They form a pattern hiding in plain sight.
One simple tip: pick one problem area and count how often it happens over a single shift. You'll probably be surprised by the number. If you want to dig deeper, read the hidden cost of slow prep for more on where those costs come from.
How Delayed Service Adds to the Bill

Slow workflow doesn't just cost labour. It also changes what goes through the till.
Where Delays Hit Revenue
Think of the pass as a motorway on-ramp. When one lane backs up, the cars behind it don't disappear. They just crawl, and the frustration spreads. A kitchen works the same way when orders take too long to leave.
Several problems tend to show up at once:
- Slower order preparation means fewer tickets cleared per hour.
- Longer waiting times get guests checking their watches, and some of them leave.
- Reduced table turnover means fewer covers in the same booking window.
- Limited takeaway capacity shows up when the kitchen simply can't absorb extra orders.
- Declined orders during busy periods are lost sales, plain and simple.
A slow ticket doesn't just hold up one table. It holds up every table waiting on that station.
Mistakes and remakes add another layer. Rushed cooks miss details, and every plate that goes back costs extra ingredients, labour and oven time. That's money spent twice on the same dish.
Food quality suffers too. A dish left under the heat lamp too long loses its texture and the fresh look that made it appealing in the first place.
Read also: what waiting costs during peak service.
The Food Cost Side of Rushed Service
Food waste is where workflow problems hit the purchasing budget directly. Rushed prep, poor stock rotation and bottlenecks all feed that waste. A cook in a hurry may over-trim a piece of meat. A delayed prep station can leave product sitting out far too long. And older stock pushed to the back of the fridge often ends up in the bin.
It's worth tracking your food waste for a month alongside your timing data, so you can see whether the two move together. You can also read the full research about hospitality food waste findings for wider context.
A Worked Example with Extra Orders
Let's say a hypothetical kitchen manages to fulfil three extra orders per peak shift after tightening up its workflow. At an assumed average order value of $40, that's $120 in potential sales. Sounds promising.
But revenue isn't profit. To see what's really left, you need the contribution margin, which is what remains after variable costs such as ingredients, packaging and card fees.
| Hypothetical Item | Amount |
|---|---|
| Gross sales | $120.00 |
| Ingredients (32%) | −$38.40 |
| Packaging | −$4.00 |
| Card fees (2.5%) | −$3.00 |
| Contribution margin | $74.60 |
The extra orders added about $74.60 of contribution, not $120. That's the number to measure against the cost of any improvement.
Avoiding Double Counting the Same Gain
Extra revenue also depends on real, unmet demand. If customers already fit within the kitchen's capacity, faster prep won't create new sales out of thin air.
Your workflow helps you catch sales that already exist. It can't conjure them up.
Be careful about counting the same gain twice. A shorter prep time might free up labour and also allow extra orders. Count it once, or be clear about why both benefits apply.
Identifying Workflow Problems During Busy Service
Guessing where the time goes almost never works. Most managers have a hunch, and it's usually about the loudest person or the station closest to the office. A short observation session will show you where the real delays are. All you need is a clipboard, a stopwatch and one observer.
Choosing the Right Shift to Observe
Pick a representative busy shift. A quiet Tuesday or a chaotic function will skew the results, and you'll end up fixing problems that only showed up on one strange night.
Aim for a normal Friday or Saturday, the kind of service you get most weeks.
Assign one person to observe and record. Ideally, this person isn't cooking on the line. A cook trying to fire tickets and watch the rest of the kitchen at the same time won't catch much.
What to Record
Watch these eight points during service:
- Staff movement between stations
- Time spent waiting for equipment
- Repeated ingredient retrieval
- Preparation delays
- Order completion times
- Dishwashing turnaround
- Congestion around workstations
- Unnecessary handling or rework
Use a simple tally sheet with one row per point. Each time something happens, make a mark. It sounds almost too basic, but a tally sheet keeps the observer focused on facts instead of impressions.
Note the duration with the timer when waits start to stretch beyond a few seconds. A brief pause is normal. A wait that drags on at the pass is the kind of thing you want to know about.
Looking for Patterns, Not Single Events
One slow ticket doesn't prove anything. Kitchens have bad moments all the time. What you're really after is the same problem showing up again and again. A cook who walks to the back store eight times in an hour is telling you something useful, even if nobody has complained.
Ask your team, too. Chefs and kitchen hands usually know where the bottlenecks are far better than managers do, because they've been working around them for years. A question like "Which task interrupts you most often?" can uncover problems that never make it onto a clipboard.
Confirming the Problem Across Several Shifts
Repeat the observation over at least three shifts before you change anything. If the same delay turns up each time, you've got a recurring issue worth fixing. If it only appears on one slammed night, it may be a one-off, and a new rack or a rota change probably won't help.
Decisions based on one unusually busy service often fix the wrong problem.
Measuring Before and After Changes
Record your baseline numbers before you change anything. Once you've adjusted a station or process, run the same observation on a comparable shift. That way the improvement is something you can see, rather than something you're hoping happened.
Tip: Try not to interfere during the first observation. Let the team work as they normally do. Otherwise you'll be measuring a kitchen trying to impress the boss with a clipboard, and that tells you very little about what an ordinary service really looks like.
Low-Cost Fixes Before Choosing New Equipment
Most workflow problems don't need new equipment. They need better organisation first, and that's usually far cheaper than people expect.
Keep Things Where They Are Used
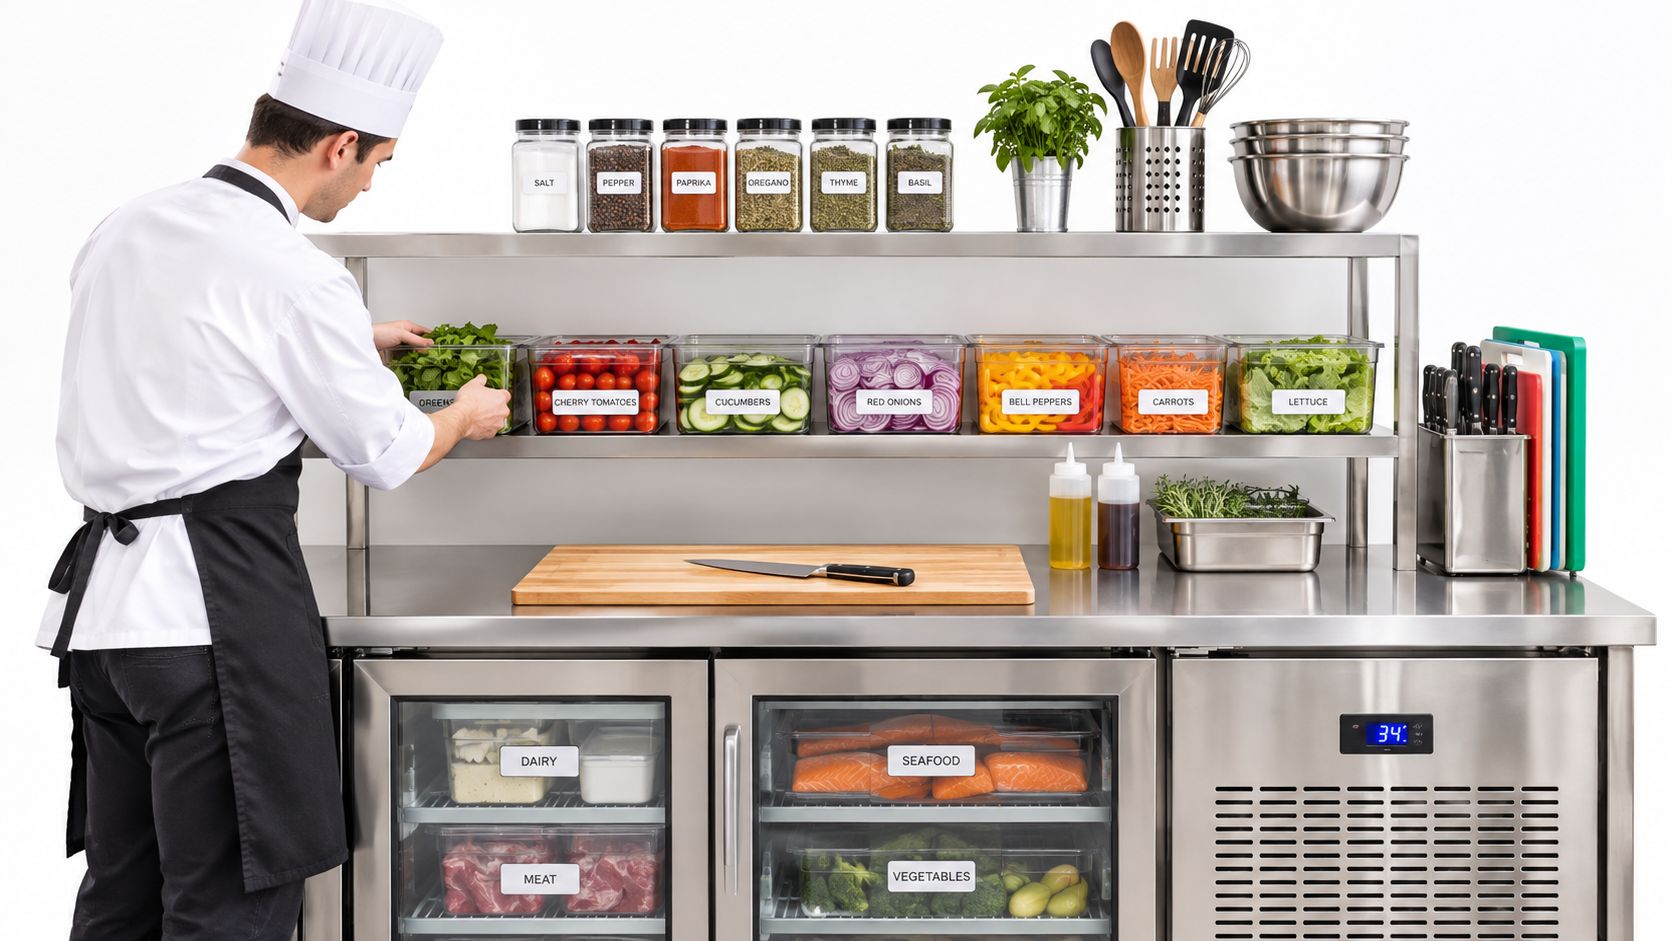
Think of a badly laid out kitchen like a supermarket where the milk is always in the far aisle. Every trip adds up. If a cook walks to the back store eight times an hour, that's a lot of wasted steps. Bring the top ten items to the station and the problem often shrinks within a day.
Utensils work the same way. Tongs and spoons belong beside the bench, not across the kitchen.
Make Storage and Prep Predictable
Consistent storage stops the searching. One simple habit is to label a shelf for your most-used garnishes, so the home is obvious even on a hectic night.
Better mise en place also cuts repeated setup. When every station is set up the same way, nobody has to hunt for the same bowl twice.
Clarify Responsibilities and Flow
When two people each assume the other is restocking the sauce station, both end up walking back and forth. Naming one owner per station fixes this quickly.
Grouping similar tickets helps too. It stops cooks switching between cold and hot tasks every few minutes. A logical dirty-to-clean dishwashing route, with a sanitiser station beside the pass, cuts down on crossing traffic.
Test every change during real service. A layout that works on a quiet afternoon can fall apart at 7pm on a Saturday.
Test One Change at a Time
Trial every change during actual service rather than assuming it works. Fixing one process can push the bottleneck somewhere else. Faster prep, for example, can overload the dishwasher within minutes.
Change one thing at a time and write down the result. Otherwise, you won't know which adjustment actually helped.
Read also: Small changes that reduce end-of-day clean-up by 30 minutes.
When Equipment Becomes the Right Answer
Equipment makes sense once low-cost changes have been tested and a genuine constraint still remains. It has to match real workflow needs, not assumed productivity gains.
- Underbench refrigeration keeps frequently used ingredients within reach. SKOPE and Atosa both offer options worth comparing across our commercial refrigeration range.
- Commercial food processors reduce repetitive prep for suitable tasks. Robot Coupe models suit many of these jobs, and you can browse food processors.
- Combi ovens from UNOX and Convotherm may consolidate cooking, depending on your menu.
- Commercial dishwashers from Winterhalter and Classeq help where washing capacity is a true bottleneck. See dishwashers.
- Stainless steel benches and shelving improve storage and prep organisation.
Giorik also offers relevant options for some prep and kitchen tasks, so it's worth comparing specifications before you decide.
Footprint, installation requirements, cleaning access and staff training all shape whether a new unit will actually help. Buying the wrong size is a common mistake, so measure clearances and test capacity against a real service. If the plan involves a substantial redesign, SACH Design can help.
If low-cost changes don't solve the problem, move on to Should You Buy New Equipment or Improve Workflow First?
Build a Simple Kitchen Workflow Cost Calculator
Most operators don't need specialist software to see where their money is leaking. A basic spreadsheet with a few rows will do the job. The table below uses the café example from earlier, so you can copy it straight into a sheet and replace the numbers with your own as you measure them.
Kitchen Workflow Cost Calculator Inputs
| Metric | Example input | How to calculate |
|---|---|---|
| Staff per shift | 3 | Count the people who work a typical service |
| Avoidable minutes per employee | 10 | Time each person with a stopwatch across a busy shift |
| Fully loaded hourly cost | $30.00 | Base wage plus leave, KiwiSaver, training and insurance |
| Operating shifts annually | 280 | Count the shifts you open each year |
| Actual overtime caused by delays | $0 confirmed | Overtime hours × overtime rate, only where it genuinely happened |
| Food waste and remakes | Track for one month | Cost of ingredients and labour discarded or remade |
| Potential additional orders | 0 counted | Extra orders fulfilled per shift × average order value |
| Contribution margin | 62% | Sales minus variable costs, divided by sales |
| Cost of proposed improvement | $1,200 (hypothetical) | Quote price plus installation and training |
Some cells say "track for one month" rather than giving a number, and that's deliberate. Until you've measured something, it's a guess, and a calculator that admits its gaps is far more useful than one full of optimistic figures.
Now for the café numbers. Three staff each losing 10 minutes per shift adds up to 30 minutes of lost time every service. At $30.00 an hour, that's $15.00 of recoverable time per shift, or $4,200 a year across 280 shifts.
That figure looks impressive, but it isn't cash in the bank. Which brings us to the next step.
Sorting Results Into Three Categories
Keep your results in three separate buckets. It's easy to add everything together and convince yourself you've found more money than you really have.
- Recoverable time: productivity that could be redirected, currently $15.00 per shift.
- Actual cost savings: reduced overtime, paid hours or waste. This stays at $0 until rostered hours really change.
- Potential additional profit: contribution from extra orders you can realistically fulfil and sell.
Think of it like a tradesperson's quote. Hours they could spend on other jobs aren't the same as invoices they've actually been paid for.
Calculating Payback With Genuine Benefits
Payback should only use benefits you can confirm. Recoverable time doesn't pay for anything until your rostered hours or sales actually change. Include installation and training in your cost estimate too, because those extras have a habit of creeping in.
Payback period = cost of improvement ÷ annual incremental benefit
Say the café spends a hypothetical $1,200 and confirms $600 in annual overtime savings. Payback comes in at two years. It's not a glamorous number, but it's honest, and honest numbers are what you'll need when you talk to your accountant or your bank.
Start With the Biggest Leak
It's tempting to redesign the whole kitchen after a few weeks of crunching numbers. Resist that urge. A leaking tap is a useful comparison here: you don't rewire the house to fix it, you find the drip and deal with it.
Rank your problems by minutes lost per shift, then tackle the largest recurring one first. A quick, visible win builds the confidence and the data you'll need for bigger decisions later.
The final thought we'd like to leave you with is this. Prevention is often better than the fix. If you're opening a new cafe or restaurant we'd strong recommend chatting with Steve or Andrew at SACH Design as they're the industry experts in sorting this before it becomes an issue.
Get in touch with Simply Hospitality via the Simply Hospitality website for help choosing the right solution for your business.