

How Much Revenue Can Better Kitchen Workflow Generate?
The popular advice is that a faster kitchen automatically creates more revenue. It doesn't. Better workflow creates productive capacity, and that capacity becomes revenue only when customer demand exists and the kitchen is the constraint preventing service. For a New Zealand operator, the commercial question isn't just “How much faster can this kitchen work?” It's how many additional orders or covers can the venue realistically serve, and what value remains after the extra costs?
That distinction matters across a sector with NZ$15.99 billion in hospitality sales in the year ended June 2025, while wage costs accounted for about 40% of revenue, according to the Restaurant Association's 2025 Hospitality Report. Small workflow gains can therefore create meaningful capacity at scale, but operators need conservative assumptions, a reliable baseline and a clear separation between additional revenue and additional financial return.
Why Better Workflow Creates Capacity Not Automatic Sales
A faster kitchen does not create customers. It creates the ability to serve more of the demand already reaching the venue, but only when the kitchen is the restriction and customers are available to use that capacity.
That distinction changes the commercial calculation. If tickets queue at the pass, orders wait for fryer space, or staff walk repeatedly between refrigeration and preparation, the venue may be losing demand without recording every missed sale. The symptoms can include longer waits, unavailable menu items, delayed delivery promises, or a booking system that appears full because the kitchen cannot support another table. Better workflow can remove that restriction. It cannot fill an empty dining room on a quiet night.
So the answer to How Much Revenue Can Better Kitchen Workflow Generate? starts with capacity, then tests how much of it the operation can sell. A change may create room for more covers, reduce order-to-table time, or let existing staff complete more productive work. Revenue is realised only when guests use that additional capacity and the resulting activity earns more than its variable cost.
Practical rule: Model the demand the venue can reasonably capture, not the theoretical output of the equipment.
The same discipline applies to labour. Wages were about 40% of revenue, and food costs typically represented another 28% to 35%, according to the Restaurant Association's hospitality wage cost reality check. Together, those costs could absorb up to 75% of revenue before rent, utilities and other fixed costs. Processing more orders through overtime, extra supervision or added menu complexity may raise sales while leaving little additional return.
A workflow project should answer four practical questions:
- Is demand being constrained? Are bookings, takeaway orders or delivery requests being declined, delayed or capped during peak periods?
- Where does service stop? Does work queue in preparation, cooking, plating, packing, the pass or washing?
- What capacity can change? Can the venue serve extra covers or orders without adding an equivalent cost burden?
- What value will remain? After food, labour, packaging, merchant fees and consumables, does the extra activity improve contribution?
Use conservative formulas. For a dine-in service, extra peak capacity equals additional covers per service multiplied by average spend per cover and the number of comparable services. For takeaway or delivery, use additional completed orders multiplied by average order value and comparable peak periods. Then subtract the costs that rise with those sales. This produces an opportunity estimate, not a promise. Front of house, customer demand, food quality and timing must all support the extra volume.
Service time can also create capacity without buying more equipment. A practical kitchen-flow review follows receiving, storage, preparation, cooking, service and washing, then removes unnecessary movement and keeps related tasks together. The kitchen workflow guidance describes a five-minute reduction in order-to-table time as potentially enabling one extra table turn per night, with the value dependent on average table spend and actual demand. The useful question is whether those lost minutes are limiting covers.
For operators comparing better kitchen design can deliver a bigger ROI than better equipment, the answer depends on the constraint. A new appliance may increase output, while a repositioned bench, clearer handoff or better storage location may create usable capacity with less complexity. Assess both before committing spend.
How to Establish Your Baseline Before You Change Anything
A workflow investment should begin with evidence from the existing operation, not a supplier catalogue or a complaint after a difficult service. Record where time goes, which costs follow from the delay and whether the same problem appears across comparable peak periods.
Use consistent definitions and observation periods. One unusually busy or quiet shift can distort the result, so repeat the measurements across several comparable services.
Build a repeatable measurement sheet
The sheet can stay simple. It needs consistent definitions, matching observation periods and enough detail to connect kitchen movement with financial outcomes.
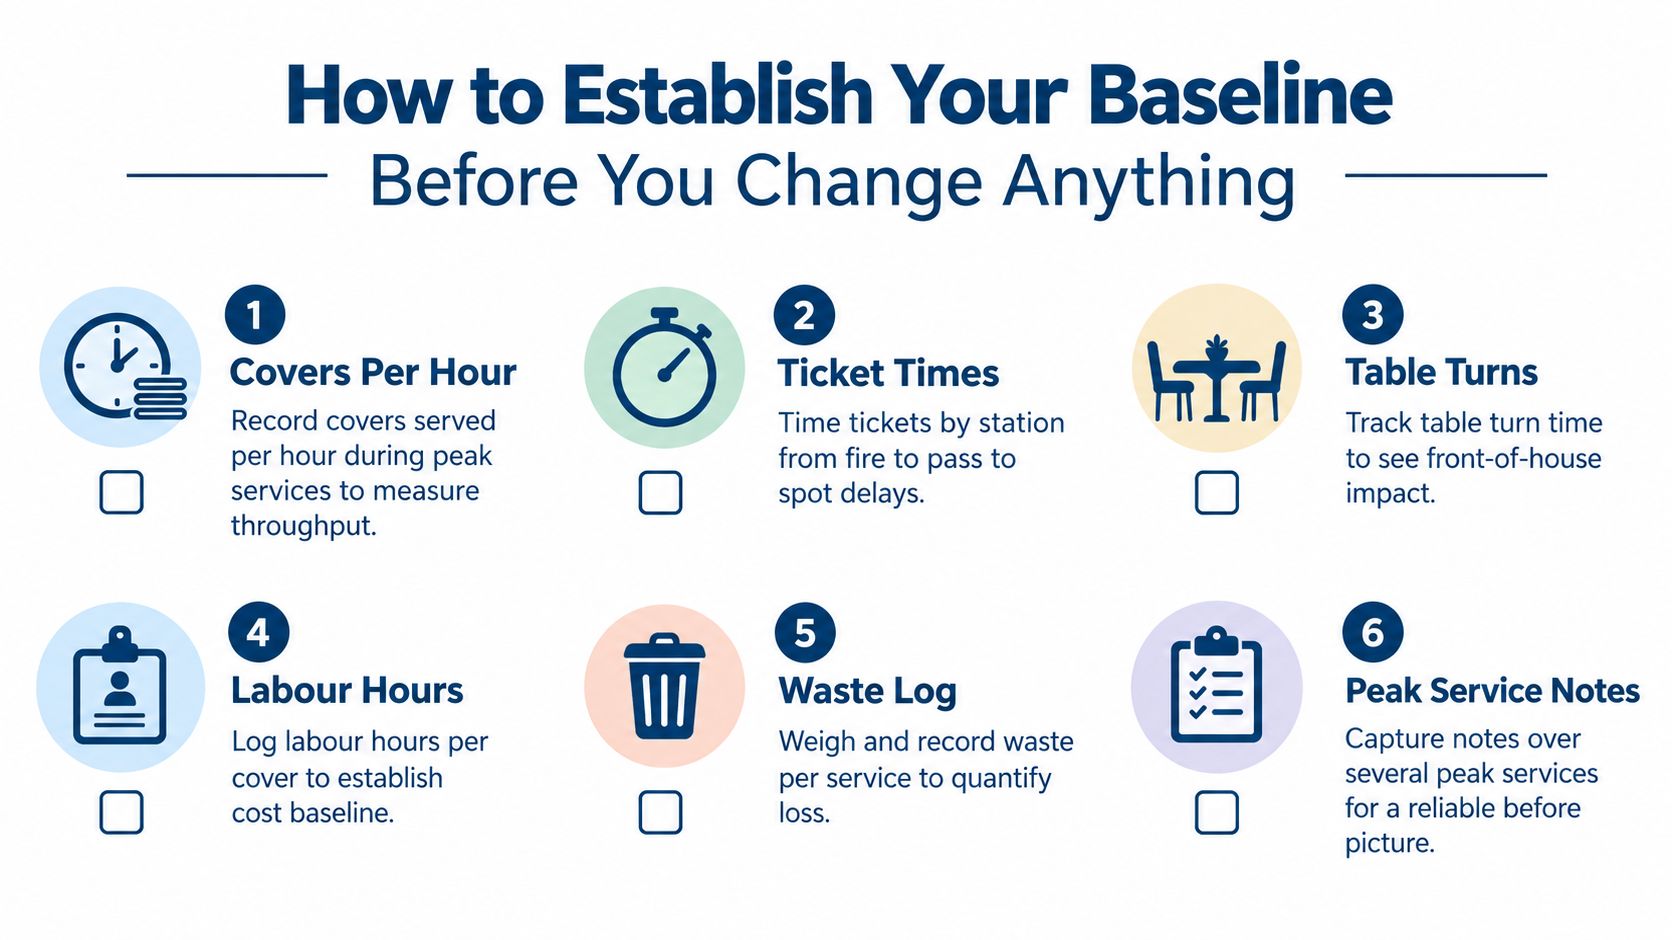
- Covers per hour: Record covers served during peak services. For takeaway or delivery, record completed orders during the relevant peak period.
- Ticket times by station: Time orders from fire to pass, then note whether the delay sits in preparation, cooking, plating or handoff.
- Table turns: Track how long tables remain occupied and how long guests wait before service. Kitchen delays can restrict front-of-house flow even when seats are available.
- Labour baseline: Record labour cost percentage against turnover, using the benchmark applied in staffing-efficiency comparisons in Stats NZ business performance ratios.
- Waste per service: Log preparation waste, spoilage, overproduction and returned food separately where possible.
- Peak service notes: Record queues, stock runs, equipment waits, re-plating, missing mise en place and points where staff cross paths.
Use these pre-change ratios as the retest baseline after any layout or equipment change. They let you separate capacity created from revenue realised, and show whether a calmer service also reduced labour leakage or improved covers.
Time the full flow, not just the cooking line
Follow receiving, storage, preparation, cooking, service and washing. Note where ingredients wait, where staff backtrack and where one task depends on another station becoming free.
A cookline may appear fast while the delay comes from prepared ingredients stored too far from the pass. Measure the refrigeration decision against the work it supports. The SKOPE ProSpec 9 Drawer Underbench Fridge, PG11.UBR.3.D9 has a nine-drawer configuration, an operating range of 1°C to 4°C, adjustable from -2°C to +15°C, and a stainless steel 304 AISI cabinet. Its left-hand configuration and separated drawers may suit a cookline where organised access matters more than conventional shelf storage. The baseline should establish whether refrigeration access is slowing production.
Retest with the same measures after the change. Include interruption risk and service disruption in the decision, using the cost of one hour of kitchen downtime alongside the purchase price.
Finding the Bottleneck in Your Kitchen Flow
The costly mistake is matching a purchase to the wrong constraint. A second fryer cannot clear a plating queue, extra oven capacity will not create productive bench space, and a larger refrigerator may worsen movement if garnishes, packaging or the pass remain out of reach.
Use a practical sequence:
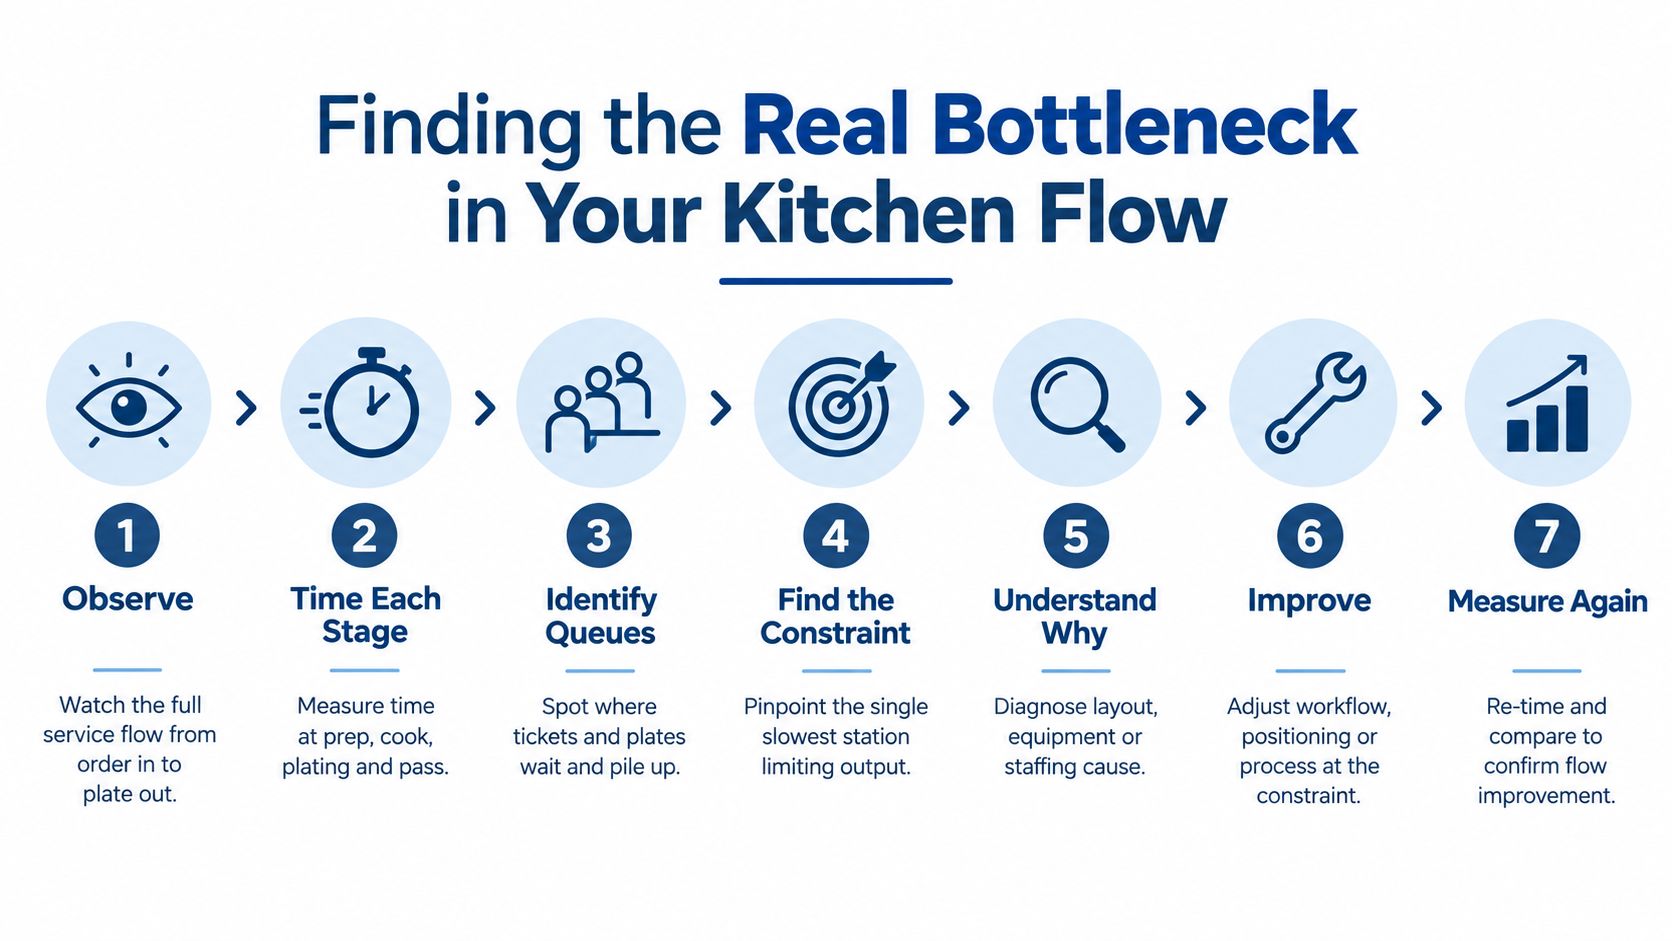
Observe → time each stage → identify queues and waiting → find the constraint → understand why → improve → measure again.
Map the handoffs
Start at receiving and follow the product through storage, preparation, cooking, service and washing. Observe a genuine peak, not only a quiet period, because the pressure points and walking paths change with demand.
Look for:
- Waiting: Tickets, trays, pans or staff sit idle because the next stage is not ready.
- Backtracking: Team members reverse through the sequence to collect ingredients, tools or packaging.
- Cross-traffic: Preparation, service and dirty warewashing routes overlap.
- Replenishment drag: Staff leave stations repeatedly for small quantities.
- Handoff ambiguity: Two people assume the other completed plating, checking or packing.
Related tasks should stay together, with unnecessary movement removed from the sequence. Each avoidable handoff can consume peak-service time, even when no individual delay appears serious.
Test the cause before selecting the remedy
When a queue appears, identify why it forms. Is the station under-capacity, badly positioned, poorly supplied, or waiting for another process? A full fryer may indicate insufficient cooking capacity, or preparation releasing batches at the wrong time. A crowded pass may reflect an undefined plating sequence rather than a need for another appliance.
Possible improvements include:
- Repositioning existing equipment.
- Adding underbench refrigeration near preparation.
- Creating more productive stainless bench space.
- Choosing food-preparation equipment that removes a repeated manual step.
- Increasing fryer or oven capacity where timed observation confirms cooking is the constraint.
- Improving dirty-to-clean warewashing flow.
- Strengthening mise en place and replenishment routines.
Digital order handling can also alter the physical workflow. Operators balancing online, takeaway and delivery demand can use this guide on how OrderOut boosts restaurant efficiency to examine fragmented order management. It will not correct a poorly positioned pass, but it may show how separate channels are adding queues or duplicated work.
A dough-focused venue should apply the same test before buying equipment. Time mixing, proofing, portioning and baking, then check where work waits. The question of whether dough production is the bottleneck should be answered by the production chain, rather than by assuming the oven causes every delay.
How to Model the Revenue Value of Extra Peak Capacity
Extra peak capacity has value only when customers are available to use it. Model the number of additional covers or orders the kitchen can complete during its constrained period, then apply a conservative utilisation assumption before treating the result as revenue.
Use this formula:
Additional covers or orders per peak service × average spend × affected peak services per week × trading weeks × realistic utilisation = potential annual additional revenue capacity
The utilisation factor keeps the estimate practical. If a redesigned kitchen theoretically permits another 20 covers but the venue expects demand for only five, use five in the model. Capacity created and revenue realised are separate figures. The difference matters when deciding whether an upgrade is justified.
Worked cover example
Consider an illustrative restaurant where a workflow change creates capacity for 10 additional covers during a busy service. At an average spend of $60:
10 covers × $60 = $600 per service
If the additional capacity applies across four busy services each week:
$600 × 4 = $2,400 per week
Across 50 trading weeks:
$2,400 × 50 = $120,000 of potential annual revenue capacity
That result assumes 100% utilisation. At 50% utilisation, the same scenario represents $60,000 of potential annual additional revenue capacity. These figures are modelling examples, not customer results, controlled sales data or promised outcomes. A venue should replace them with its own demand and service records before approving spend.
Worked order example
A takeaway or delivery kitchen may measure capacity by completed orders rather than covers. Suppose the workflow theoretically allows 8 additional orders during each Friday and Saturday peak, with an average order value of $35:
8 orders × $35 × 2 peak services = $560 per week
Across 50 trading weeks:
$560 × 50 = $28,000 of potential annual revenue capacity
The kitchen realises that value only if its capacity is currently restricting customer demand. If orders are not being lost or deferred, the improvement may still reduce labour leakage or improve timing, but those operational gains should be modelled separately rather than counted as new sales.
| Scenario | Inputs | Weekly Capacity | Annual Capacity at 100% | Annual Capacity at 50% Utilisation |
|---|---|---|---|---|
| Additional covers | 10 covers × $60 × 4 services | $2,400 | $120,000 | $60,000 |
| Additional orders | 8 orders × $35 × 2 peak services | $560 | $28,000 | $14,000 |
Revenue isn't profit
Additional sales carry variable costs, including:
- Food cost: Ingredients consumed for the extra covers or orders.
- Labour: Additional hours, overtime, supervision or training.
- Packaging: Containers, lids, bags and labels for takeaway or delivery.
- Merchant fees: Transaction costs attached to payment processing.
- Consumables: Cleaning products, disposables and other service inputs.
- Other variable costs: Costs that rise with production or order volume.
Calculate potential annual revenue capacity first. Then estimate the incremental gross profit or contribution remaining after those costs. A projected $120,000 in additional revenue is not $120,000 of ROI. The investment pays back through the contribution from extra sales, plus separately verified labour or waste benefits.
The same test applies when assessing whether a faster pizza oven can increase restaurant revenue. Faster output has commercial value when the oven restricts completed orders and customers are waiting to buy. If demand is quiet or another station limits completion, extra oven speed creates capacity without equivalent revenue.
When Workflow Pays Back Without Extra Sales
Extra covers are not the only way better workflow creates financial value. A kitchen can produce the same sales with less walking, reaching, waiting and repeated handling. That capacity may reduce labour pressure, release staff time for other work or delay the need for another hire.
Use a measured formula:
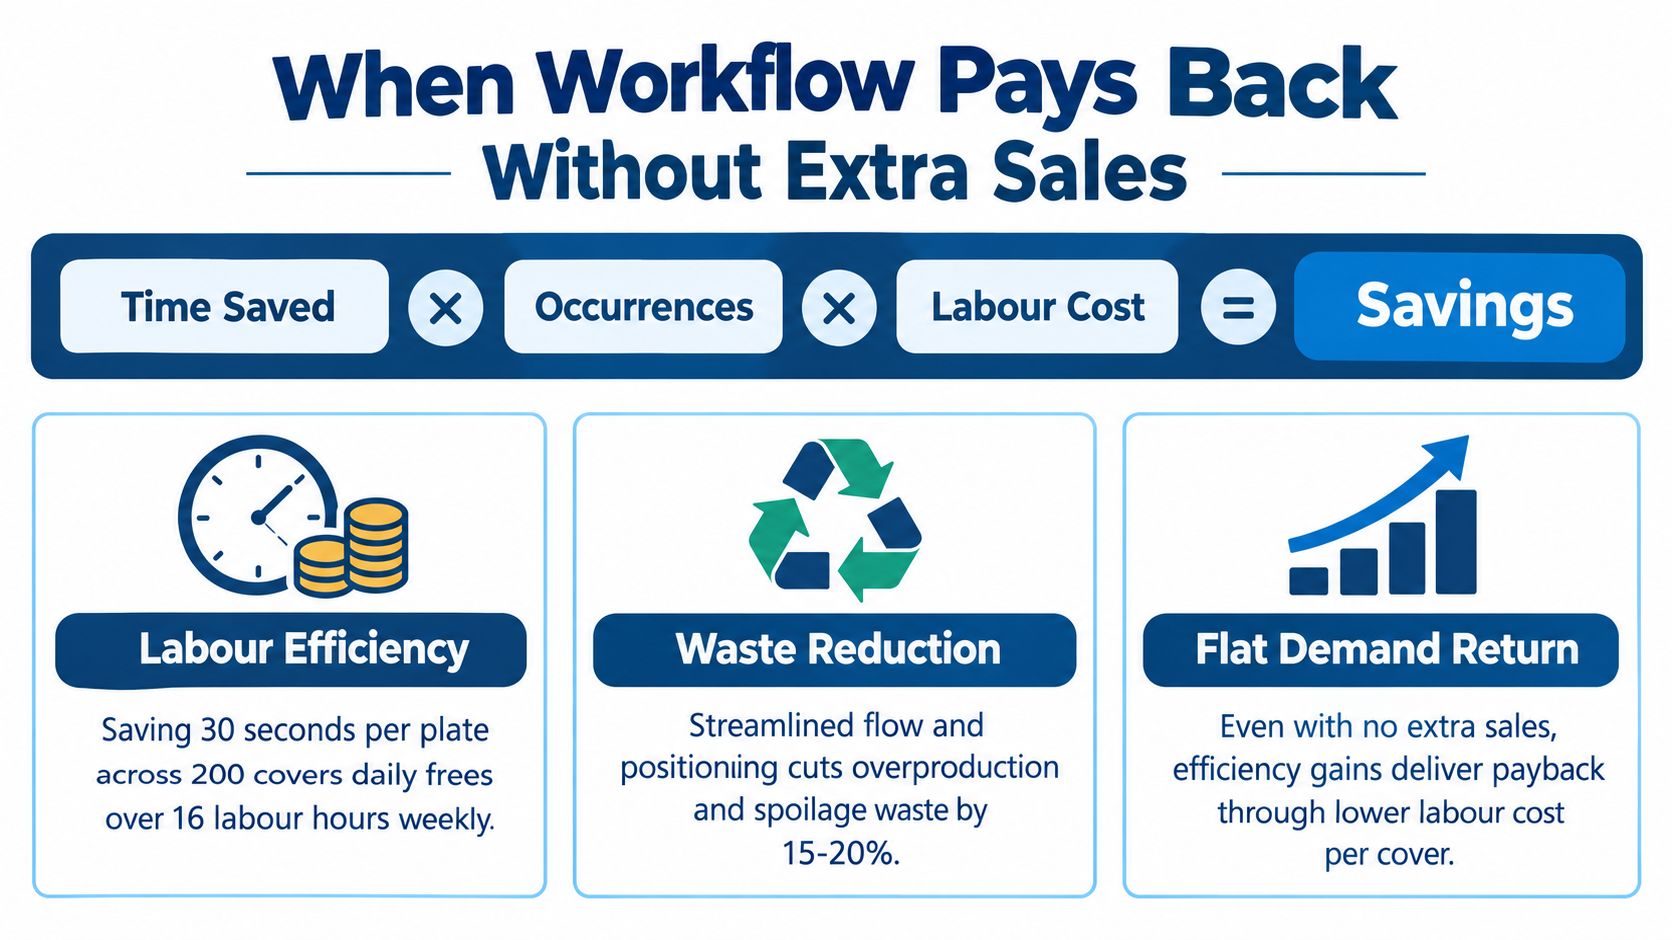
Time saved per occurrence × number of occurrences × labour cost = potential labour value
A small saving matters when it repeats throughout service. Saving 20 seconds on a task completed 200 times during service creates more value than the same saving occurring once. Measure the task before and after the change, count how often it occurs and apply the relevant labour cost. Treat the result as potential value until payroll, roster or output data confirms it.
Where repeated motion creates value
Look first at routine movements repeated in every service:
- Refrigeration to preparation: Keep frequently used ingredients near the preparation point, while maintaining suitable food safety and access controls.
- Ingredient movements: Reduce transfers between storage, prep containers and the cooking line.
- Plating flow: Set plates, garnishes and finished components in an order that supports the pass.
- Cooking access: Keep common utensils and equipment within reach so cooks do not leave the station unnecessarily.
- Dirty-to-clean warewashing: Separate dirty ware from clean storage and service collection to reduce cross-traffic.
Measure occurrences rather than relying on staff impressions. A short observation period can show whether relocating refrigeration, adding bench space or defining a staging point removes a repeated task.
Waste is another workflow cost
New Zealand cafes and restaurants generate about 24,375 tonnes of food waste each year, and 61% is avoidable, according to the DigitalNZ record on food waste. Preparation, batching, storage and portioning therefore affect both workflow and recoverable value.
A New Zealand hospitality waste audit recorded more than 13 tonnes of food waste from 108,730 covers, averaging 171 grams per cover and about $0.94 per cover, as reported in food waste insights from Restaurant and Café. Use that benchmark for comparison, not as a forecast. Your own waste log should show where the cost sits.
Better flow can improve mise en place accuracy, storage rotation and batch sizing. It will not remove unavoidable waste or replace stock control, but it can reduce overproduction, unnecessary handling and spoilage risk.
Labour value should be calculated from actual payroll data. The average hospitality hourly rate in New Zealand is NZ$27.84, as noted earlier. Use your venue's applicable rate, then retest the saving after the workflow change. A payback case is strongest when the same sales are delivered with fewer paid hours, less waste or more reliable service capacity.
Designing Workflow Right and Choosing Your Next Upgrade
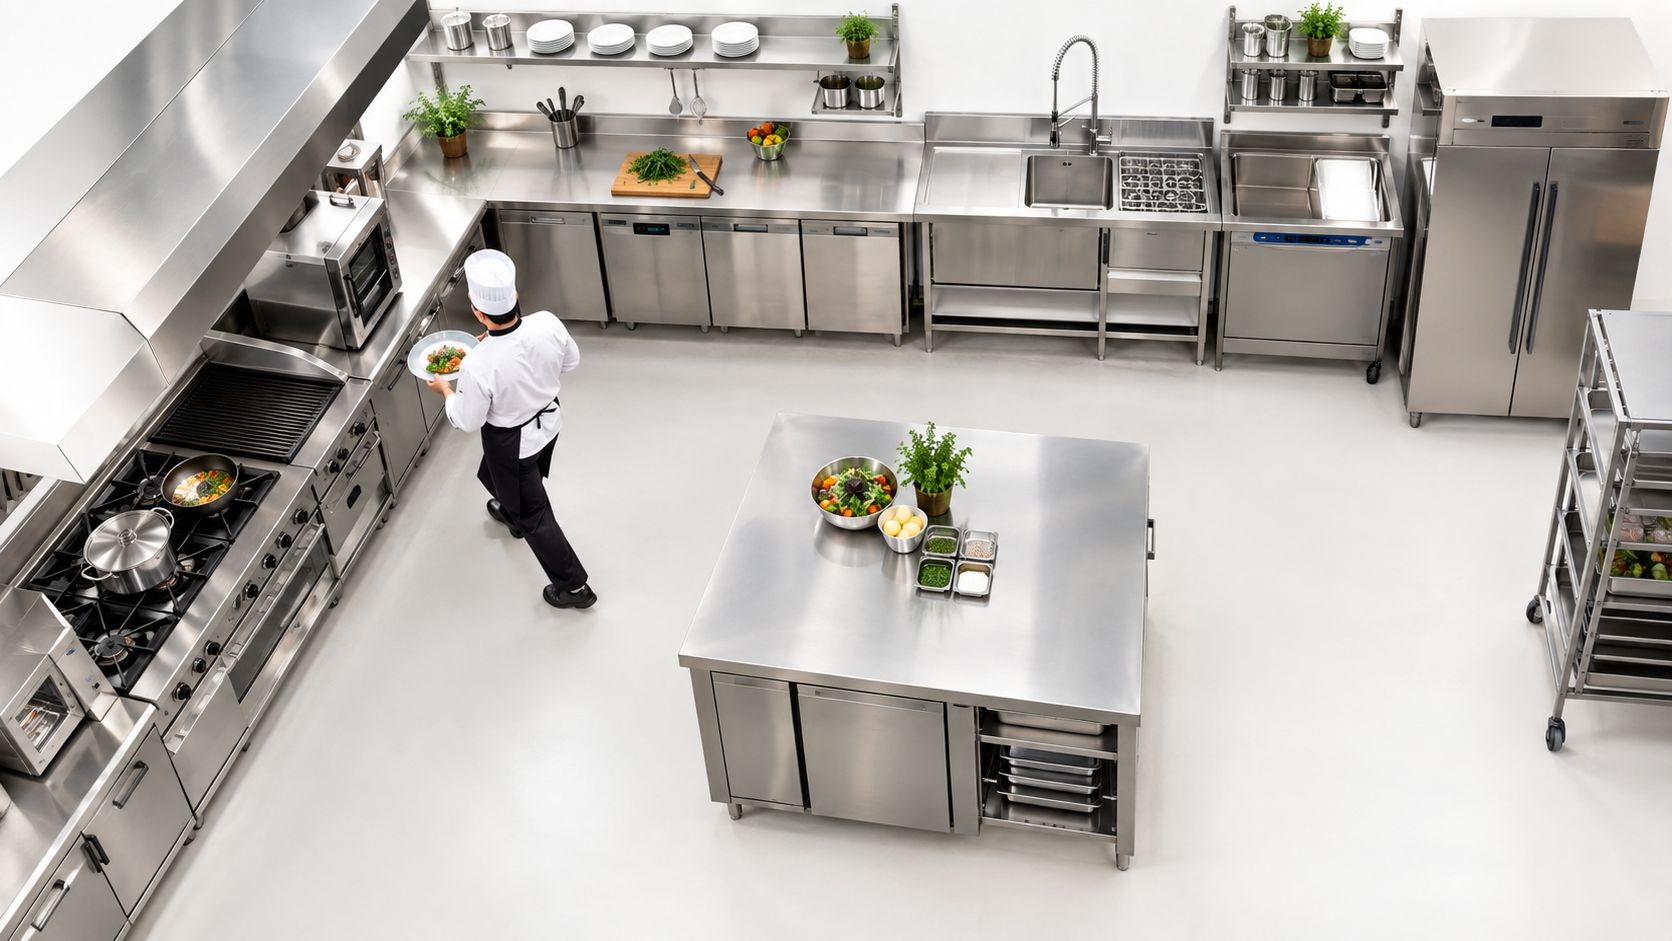
A new appliance cannot correct a poor sequence. SACH Design maps staff movement, equipment position, production order, refrigeration access, preparation, cooking, plating, warewashing, utilities and future capacity as one connected kitchen plan.
Do that work before installation. Adjusting equipment on a drawing is simpler than relocating plumbing, electrical services, extraction or fixed equipment after construction. A layout can appear efficient on its own and still fail when staff, deliveries, dirty ware and peak production share the same route.
Choose the smallest change that removes the constraint
The next upgrade may be a low-cost repositioning rather than a major appliance. Options include underbench refrigeration, productive bench space, more capable food-preparation equipment, greater fryer or oven capacity, improved warewashing or better mise en place.
Use a practical sequence:
- Confirm the constraint through observation and timing.
- Test whether existing equipment can be repositioned.
- Compare layout-adjustment cost and disruption with a new appliance.
- Model contribution after labour, waste and operating costs, not sales alone.
- Retest ticket times, labour percentage, waste and throughput after the change.
Operators wanting broader process context can read this guide to workflow optimization, then adapt the principle to the venue's menu, service pattern, cleaning requirements, available services and production plans. A generic system cannot account for those trade-offs.
Start with one low-cost test. Reposition underbench refrigeration, record ticket times across comparable peak services, and compare labour and waste with the baseline. If the constraint remains, the results give you a stronger case for a larger appliance or layout change. For a further equipment comparison, review which commercial kitchen upgrade delivers the fastest return on investment.
Hospitality supplies commercial refrigeration, cooking equipment, food-preparation equipment, dishwashing systems, stainless fabrication and kitchen-planning support for New Zealand hospitality businesses. For help connecting a workflow problem with the right equipment or SACH Design layout, visit Simply Hospitality and discuss the venue's service pattern, constraints and capacity goals with the team.