


How Much Does Slow Service Really Cost Your Restaurant?
Slow service doesn't have one fixed dollar cost. Its real cost depends on what those lost minutes stop your restaurant from selling, and when delays block demand during peak service, even a small recurring loss can become $36,000 of potential annual revenue capacity in a simple illustrative example.
A lot of advice on this topic gets the logic backwards. It treats all slow service as equally expensive, when it isn't. Faster service at a quiet 3pm period may improve customer experience, but it won't necessarily create extra sales if tables are already empty. The same five minutes on a packed Saturday dinner can stop an extra table from being reseated, delay takeaway orders, and turn a queue into a walkaway.
That distinction matters more in New Zealand than many operators realise. ServiceNow's 2024 customer experience research reported that New Zealanders spent 22.3 million hours on hold in 2023, and estimated NZD$167 million in lost productivity during work hours. The same research said 57% of Kiwi consumers would take their business elsewhere after waiting only two to three days for an issue to be resolved, while businesses were taking an average of 5.9 days to resolve complaints, as covered in this New Zealand report on customer service delays. Restaurants aren't call centres, but the customer behaviour is familiar. People don't stay patient forever.
Hospitality operators already know that long waits frustrate guests. The more useful question is how much does slow service really cost your restaurant when demand is there and the operation can't keep up. That answer sits in the chain from customer order, to production, to service, to table occupancy, to the next order you could have taken.
Why Slow Service Only Costs You When Demand Exists
The common assumption is simple. Faster always means more revenue.
It doesn't.
A restaurant can cut table time on a quiet mid-afternoon shift and still make no additional money because there's nobody waiting to take the seat. The value of speed only becomes directly measurable when customer demand exceeds available capacity.
Busy periods are where the money is won or lost
Think about the sequence commercially, not emotionally:
- Customer arrives: They book, queue, or walk in.
- Order enters the system: Front of house takes the order and passes it to the kitchen.
- Food is produced and served: Prep, cook, plating, and running all take time.
- Table stays occupied: Guests eat, linger, pay, and leave.
- Table is cleared and reset: Only then can the next customer be seated.
If one link in that chain stretches during a period when people are waiting, revenue capacity shrinks. If nobody is waiting, speed still matters for service quality, but not every minute has a direct sales value.
Slow service becomes a financial problem when it prevents the next sale, not simply when it feels slow.
That's why the busiest 30 to 90 minutes usually matter more than daily averages. A venue can post an acceptable average ticket time across the whole shift and still lose real revenue in the exact window when demand is highest.
New Zealand operators already see the warning signs
The Restaurant Association of New Zealand's 2019 Hospitality Report said long waiting times rank among the main frustrations for diners, and the Association later reported that total hospitality sales reached NZ$15.99 billion for the year ended June 2025, up 1.4% year on year, according to the Restaurant Association's hospitality reporting. In a sector that large, small service losses repeated across busy periods add up quickly.
A common issue seen across hospitality businesses is that operators focus on speed in the abstract instead of asking a sharper question. What sale was blocked by the delay?
That same logic also sits behind What Does Waiting Cost During Peak Service, especially where kitchen delay and demand collide. The important distinction here is customer-facing capacity. Not just staff frustration in the back of house.
What doesn't work
Operators often try to fix “slow service” with broad pressure on staff.
That usually misses the point.
- Telling staff to move faster: Useful only if the issue is individual pace, which often isn't the case.
- Looking at whole-day averages: This hides peak-period constraints.
- Assuming every delay costs the same: It doesn't. Empty periods and waitlisted periods are commercially different.
The right starting point is to isolate the periods where customers were ready to spend, but the operation couldn't serve them fast enough.
Measuring the Complete Service Journey Not Just Ticket Time
Most venues track something. Fewer track the whole journey that determines revenue capacity.
Ticket time matters, but it only captures one section of the process. A commercially useful measure starts when the guest is seated and ends when the table is available again.
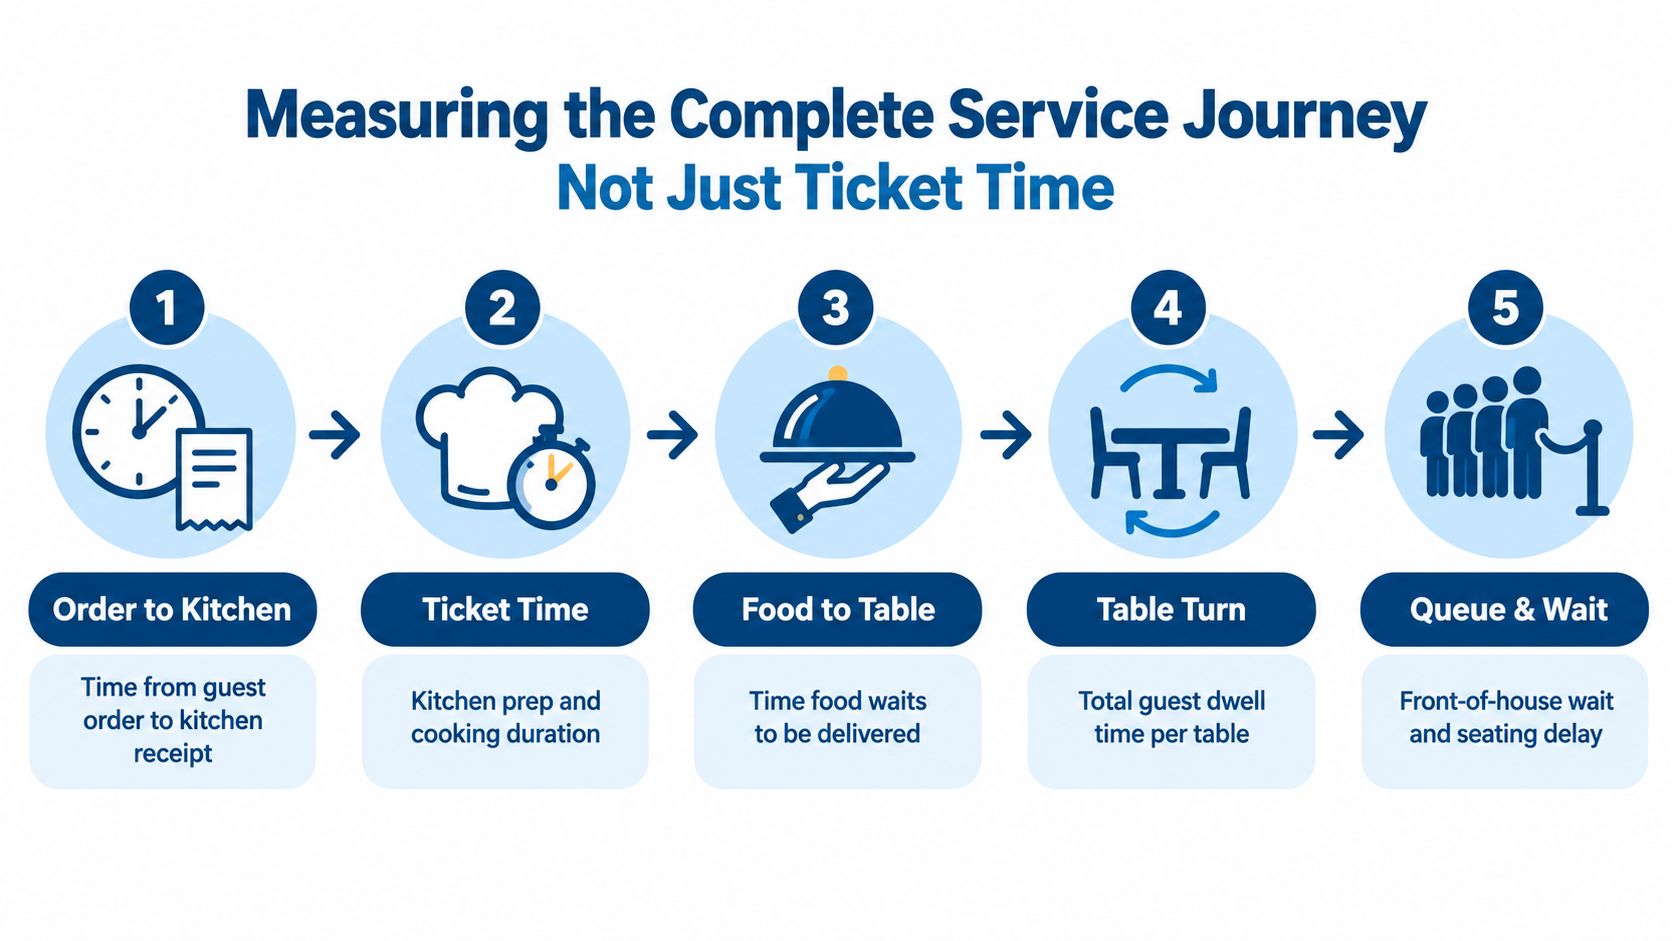
The stages worth measuring
A practical KPI set usually includes:
- Order-to-kitchen time: How long it takes from guest order to kitchen receipt.
- Ticket time: Time from kitchen receipt to food ready.
- Preparation time: Knife work, batching, portioning, assembly before cooking.
- Cooking time: Grill, fryer, oven, salamander, or other station time.
- Plating time: Finishing, garnishing, checking, and handoff to pass.
- Food-to-table time: How long finished dishes wait before they reach guests.
- Table occupancy time: Seat occupied from sit-down to payment and departure.
- Clearing and reset time: Bussing, wiping, resetting, and making the table saleable again.
- Queue or waitlist during peak: Guests waiting to be seated, served, or collected.
Why average ticket time can mislead
A venue might average acceptable ticket times across lunch and dinner while still failing badly from 12pm to 1pm on Saturday. That matters because peak demand is where capacity has dollar value.
Practical rule: Measure the whole table cycle during the periods when customers are actually waiting. That's where service speed becomes revenue capacity.
The commercially relevant journey is often best framed like this:
Seated → ordered → food produced → food served → table cleared → table available again
That full cycle shows where time is being spent and where hidden dead time sits between stages.
Where hidden delays often sit
In many operations, the kitchen isn't the only culprit. The hold-up may sit in the handoff between stations.
For example:
- Orders may sit before they're keyed.
- Food may be ready but waiting on a runner.
- Tables may be paid but uncleared.
- Clean crockery may be available, but not in the right place.
- Prep may be manual and inconsistent when a processor would remove repetitive work, which is why articles like what is the cost of manual food preparation in a commercial kitchen are useful alongside service analysis.
Use peak-window snapshots, not just full-shift reports
Many operators choose to measure a single service by quarter-hour or half-hour blocks during the busiest periods. That gives a truer picture than full-day averages.
One consideration regularly discussed with customers is that a venue doesn't need a complicated data system to start. A simple service log can still show:
| Stage | What to watch during peak | Why it matters |
|---|---|---|
| Order entry | Delays before kitchen receives the ticket | Lost time before production even starts |
| Cooking | Orders queuing at one station | Signals constrained throughput |
| Pass | Ready food waiting to run | Quality and service timing suffer |
| Table reset | Empty tables not saleable yet | Directly delays the next cover |
When operators measure only ticket time, they often diagnose the wrong problem.
So What Can Slow Service Cost
Five slow minutes do not automatically cost a restaurant money. They cost money when those five minutes stop you serving demand that was ready to buy.
That distinction matters because plenty of venues chase faster service during periods that are not full anyway. In that case, the gain is limited. During a packed Friday dinner, the same delay can cap throughput for the whole service.
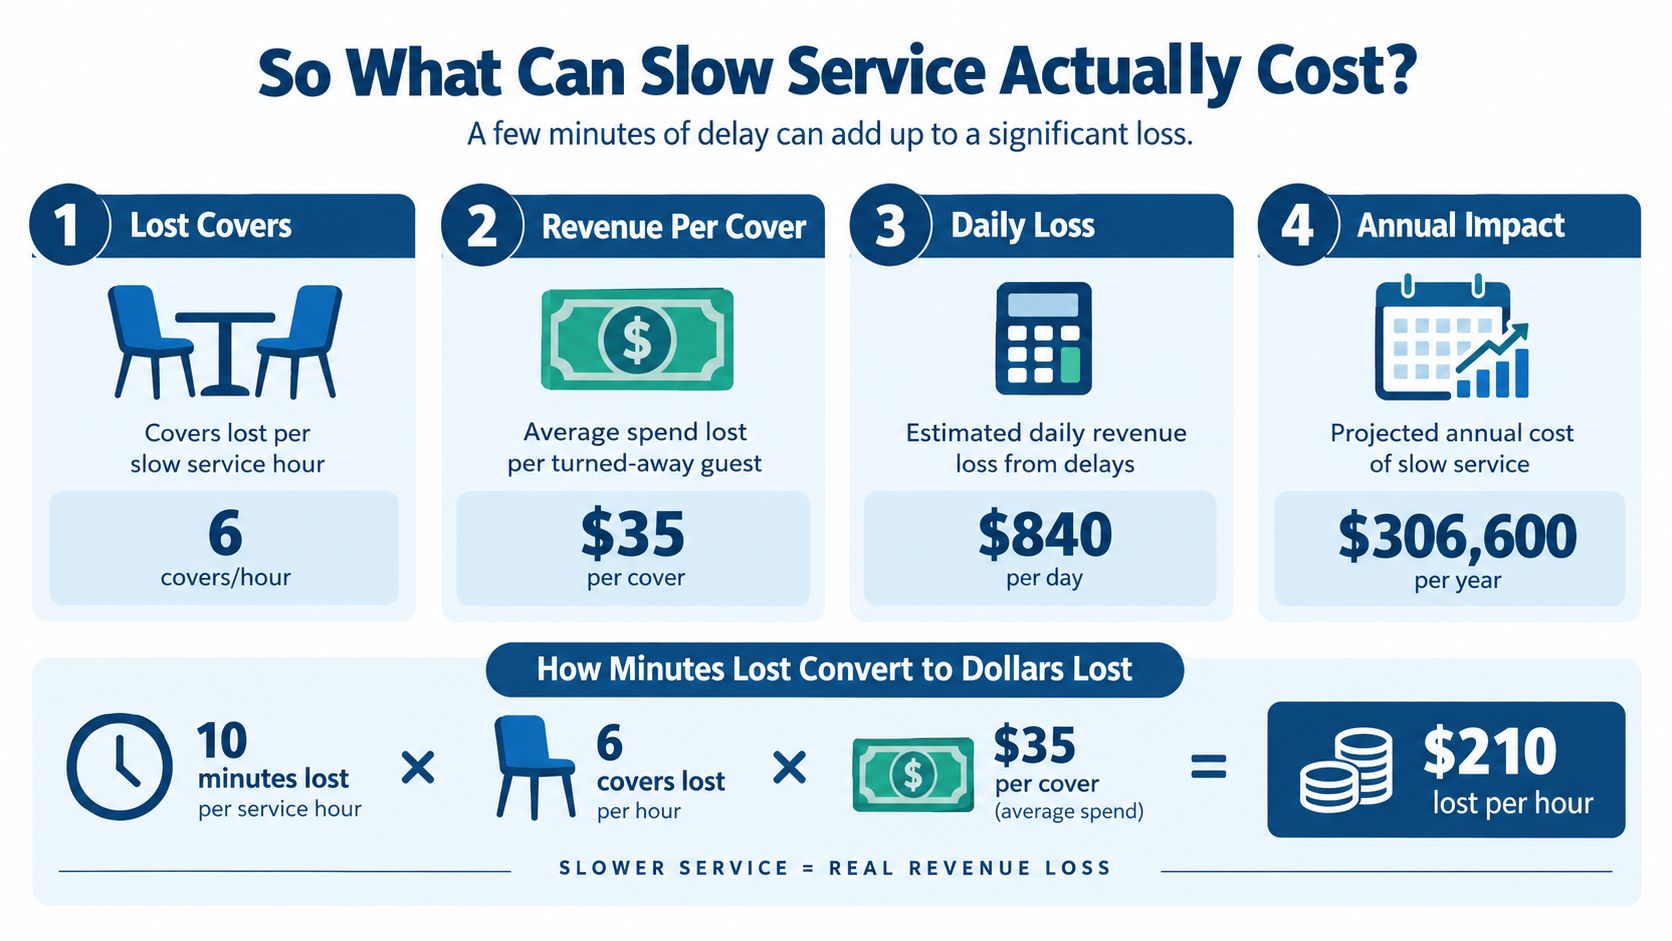
A simple worked example
Take a 20-table venue with a $120 average spend per table during the dinner peak.
If service friction means two tables miss one extra sitting they could have turned during that busy window, the lost revenue capacity is:
2 tables x $120 = $240 per affected service
If that happens across three demand-constrained services each week:
$240 x 3 = $720 per week
Across 50 trading weeks:
$720 x 50 = $36,000 in annual revenue capacity
That is the right way to read the number. It is not “slow service costs $36,000” in every case. It means the venue may be capping sales by that amount if customers are there and the operation cannot cycle them through.
Revenue capacity is not profit
This example is illustrative only. It is not customer data or a market benchmark.
The $36,000 figure is top-line revenue capacity. It still needs to be reduced by food cost, direct labour pressure, packaging if relevant, merchant fees, and any other variable cost tied to serving those extra covers or orders.
The better question is straightforward. Can this change generate enough additional demand-constrained sales to justify the spend and the disruption involved in making it?
Sometimes the answer is yes. Sometimes the answer is no, especially if the venue is only full for a narrow window or the proposed fix adds cost faster than it adds throughput.
Where operators often misread the loss
The cost rarely shows up as one dramatic blowout. It usually appears as repeated missed opportunities in services that were already tight.
A table sits uncleared for eight minutes at the peak. A takeaway queue stalls because handoff is messy. A batch of glasses or crockery has to be washed again, which pulls labour and equipment time away from service. That kind of rework matters because it removes saleable capacity during the busiest part of trade. Rewashing in a commercial kitchen is a good example of waste that does not just raise cost. It can also slow the next customer-facing step.
What matters is frequency. If the same pinch point shows up several times a week during full services, a small delay becomes a real commercial constraint.
Calculate Your Own Potential Revenue Capacity
A five-minute delay only has a dollar value when customers were ready to buy and the operation could not take them.
That is the test. If Tuesday lunch is half full, faster service does not create extra revenue on its own. If Friday dinner has a waitlist, takeaway tickets stack up, and tables sit occupied longer than they need to, lost capacity is worth measuring.
A practical model is:
Extra tables, covers, or orders you could serve during constrained periods × average spend in that period × number of affected peak services × realistic utilisation = potential revenue capacity
Keep it conservative. The point is not to prove the biggest possible upside. The point is to decide whether a fix is worth the spend, training time, and disruption.
A worked example
Say a venue turns away demand on two dinner services a week because the table cycle is running long. By tightening one pinch point, the team believes it can serve 4 extra tables in each of those services. Average spend is $95 per table. To avoid overstating the case, utilisation is set at 75%, not 100%.
The calculation is:
4 extra tables × $95 × 2 services per week × 52 weeks × 75% = $29,640 in annual revenue capacity
That is top-line capacity, not profit. Food cost, direct labour, card fees, and any extra packaging still come off. But it gives operators a useful first screen. If the likely gain is modest, a large capital spend may not stack up. If the gain repeats across many constrained services, even a small delay can justify attention.
Your Potential Revenue Capacity Calculator
| Input | What to Enter | Conservative Tip |
|---|---|---|
| Additional tables, covers, or orders that could be served | The extra volume the venue could genuinely handle if the delay was removed | Count only capacity backed by real demand, not hopeful volume |
| Average spend | Typical spend per table, cover, or order in the affected service period | Use the trading average for that service, not the best shift of the month |
| Affected peak services | The number of busy services where this bottleneck limits sales | Include only services where demand is higher than current capacity |
| Realistic utilisation | The share of those extra opportunities likely to be filled | Use a cautious assumption instead of assuming every slot sells |
Keep the assumptions tight
The usual mistake is counting every service, using peak spend, and assuming every recovered slot fills. That can make an average improvement look like a strong business case.
A better approach is narrower and more useful:
- Count only demand-constrained periods: Full bookings, waitlists, walkaways, queue build-up, or delayed handoff are the signals worth using.
- Use the spend for that service: Lunch, dinner, delivery, and weekend brunch often produce very different averages.
- Apply realistic utilisation: Some added capacity will sell every time. Some will not.
- Separate revenue from margin: More throughput can still be poor buying if the extra sales are low margin or labour heavy.
The unit is not always a table
For some operators, the right unit is a takeaway order, a coffee round, or one more booking slot in a compressed service window.
That same demand-capacity logic sits behind calculating what better kitchen workflow can add in revenue capacity. The gain comes from serving more real demand in the periods that are already tight.
One more check matters here. Base the estimate on the full service cycle, not one faster kitchen step. If meals leave the pass sooner but clearing, payment, pickup handoff, or reset still lag, the venue may not gain an extra saleable slot at all.
Finding the Bottleneck in Your Operation
Slow service usually gets blamed on pace. In busy venues, the bigger issue is flow.
If five extra minutes does not block another order, another table, or another pickup handoff, it is irritating but it is not the main revenue constraint. The cost shows up when demand is already there and one stage cannot release enough capacity to serve it.
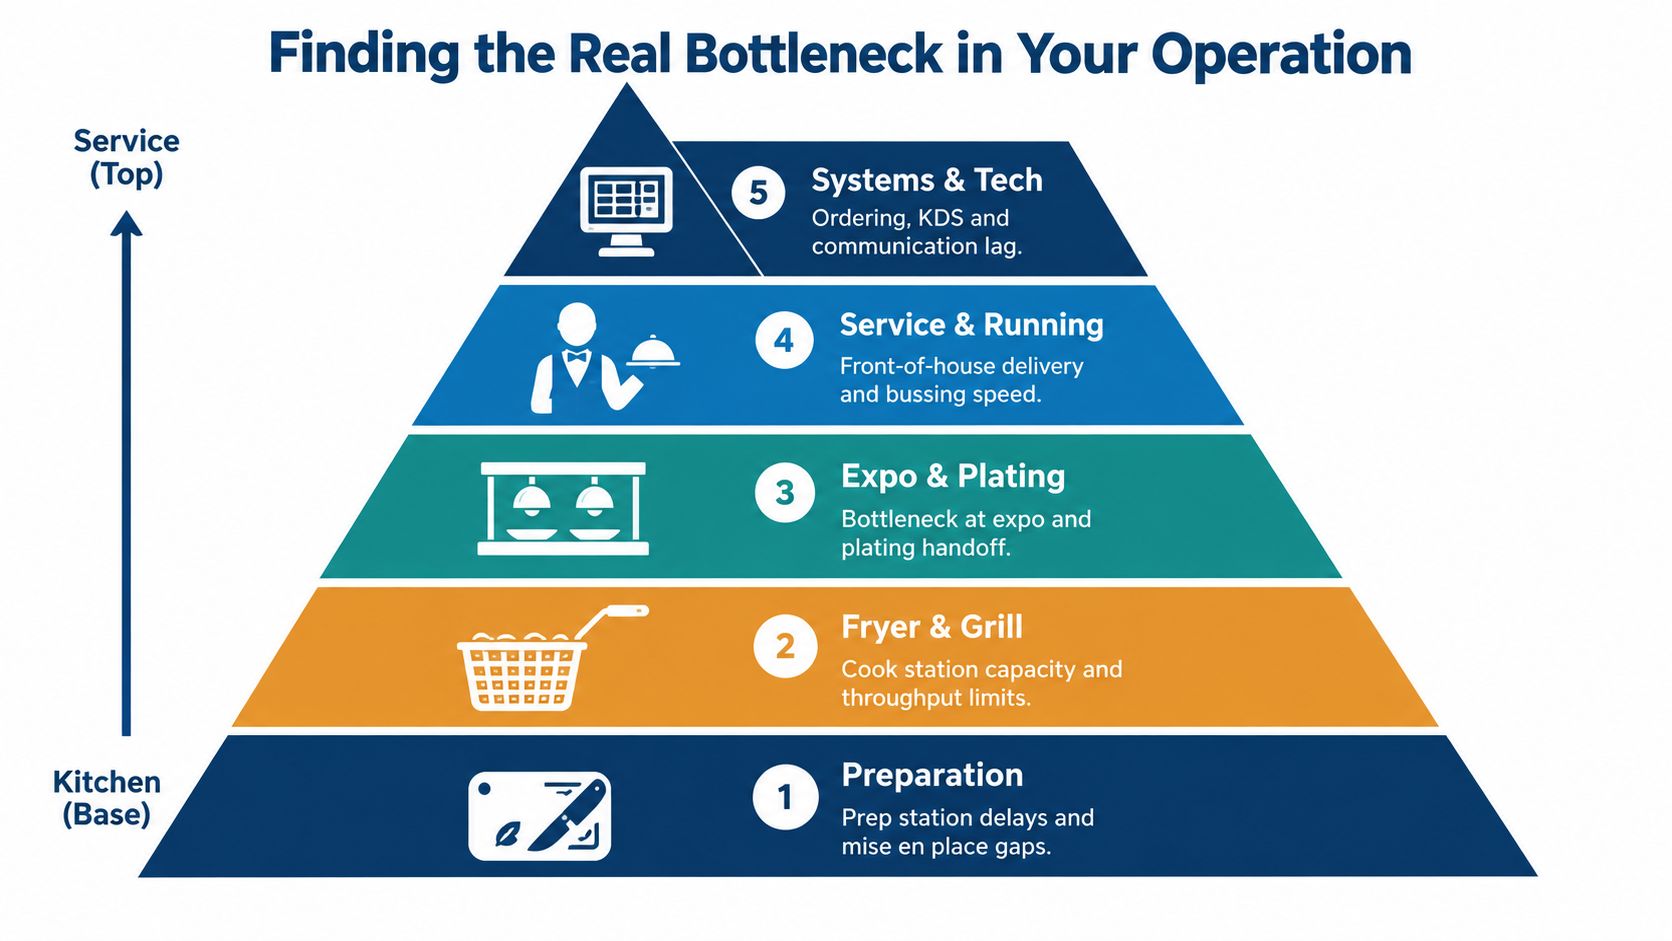
A bottleneck is the point that caps throughput for the whole service. It might be a fryer loaded with too many menu lines, one staff member building every dessert, a cramped pass, delayed table resets, or a POS setup that sends messy dockets into the kitchen. Staff can look flat out and still not be working at the stage that is limiting covers.
A quick test helps. During a full period, ask one blunt question: where is work waiting? Start there.
Where capacity usually gets capped
Common pressure points include:
- Preparation: Too much hand work before service, or prep still happening during peak
- Fryer capacity: One fryer handling chips, chicken, seafood, and sides
- Grill space: Proteins and finishing items competing for the same section
- Oven use: Bakes, reheats, and service finishing all sharing one cavity
- Plating and expo: Food cooked on time but held at the pass
- Fridge placement: Staff walking for core ingredients all service
- Warewashing: Plates, glasses, or utensils not getting back into circulation fast enough
- Front and back communication: Orders, modifiers, and table status not moving cleanly
- Clearing and reset: Guests gone, table still not saleable
The trick is to match the delay to the demand it blocks. If the fryer is backed up but dine-in tables are half empty, the commercial problem may be smaller than it looks. If a 12-minute table reset is stopping new walk-ins at Friday lunch, that is a harder cap on revenue.
Use one worked example, not guesswork
Say the kitchen sends mains fast enough for 60 covers in a service, but the pass and runners only complete 48 without food waiting and quality slipping. Your limit for that service is not kitchen output. It is 48 completed covers.
Or take a pizza venue. Dough balls are ready for 80 pizzas, the oven can finish 70, but one bench can only stretch and top 55 during the rush. The practical ceiling is 55 until that bench process changes. If that pattern sounds familiar, it is worth reading whether dough production is limiting throughput.
Systems can be the bottleneck too
A surprising number of delays start before a pan is on the heat. Poor routing, modifier confusion, unclear firing, and weak table-status visibility all create hesitation and rework.
For operators reviewing that side of service, it helps to compare restaurant POS systems based on order flow, docket handling, and floor visibility, not only payments. More labour will not fix information moving badly through the venue.
What to inspect in a live peak
Watch one busy service from order to handoff and note where work stalls for more than a moment.
Look for:
- Tickets stacking at one station
- Food plated but waiting for runners
- Staff crossing paths for the same tools or ingredients
- Clean stock trapped in the dish area
- Guests ready to pay while terminals or staff are tied up
- Empty tables sitting uncleared during active demand
That gives you the first constraint worth fixing. Not the busiest-looking area. The stage that is stopping the next sale from happening.
Why Fixing One Stage Rarely Fixes Service Speed
A faster station does not automatically create more sales.
It only creates more sales if that stage was the constraint during a period when guests were waiting, orders were backing up, or tables could have turned sooner. If demand is already covered, a speed gain is still useful for labour pressure and consistency, but it will not lift peak revenue capacity on its own.
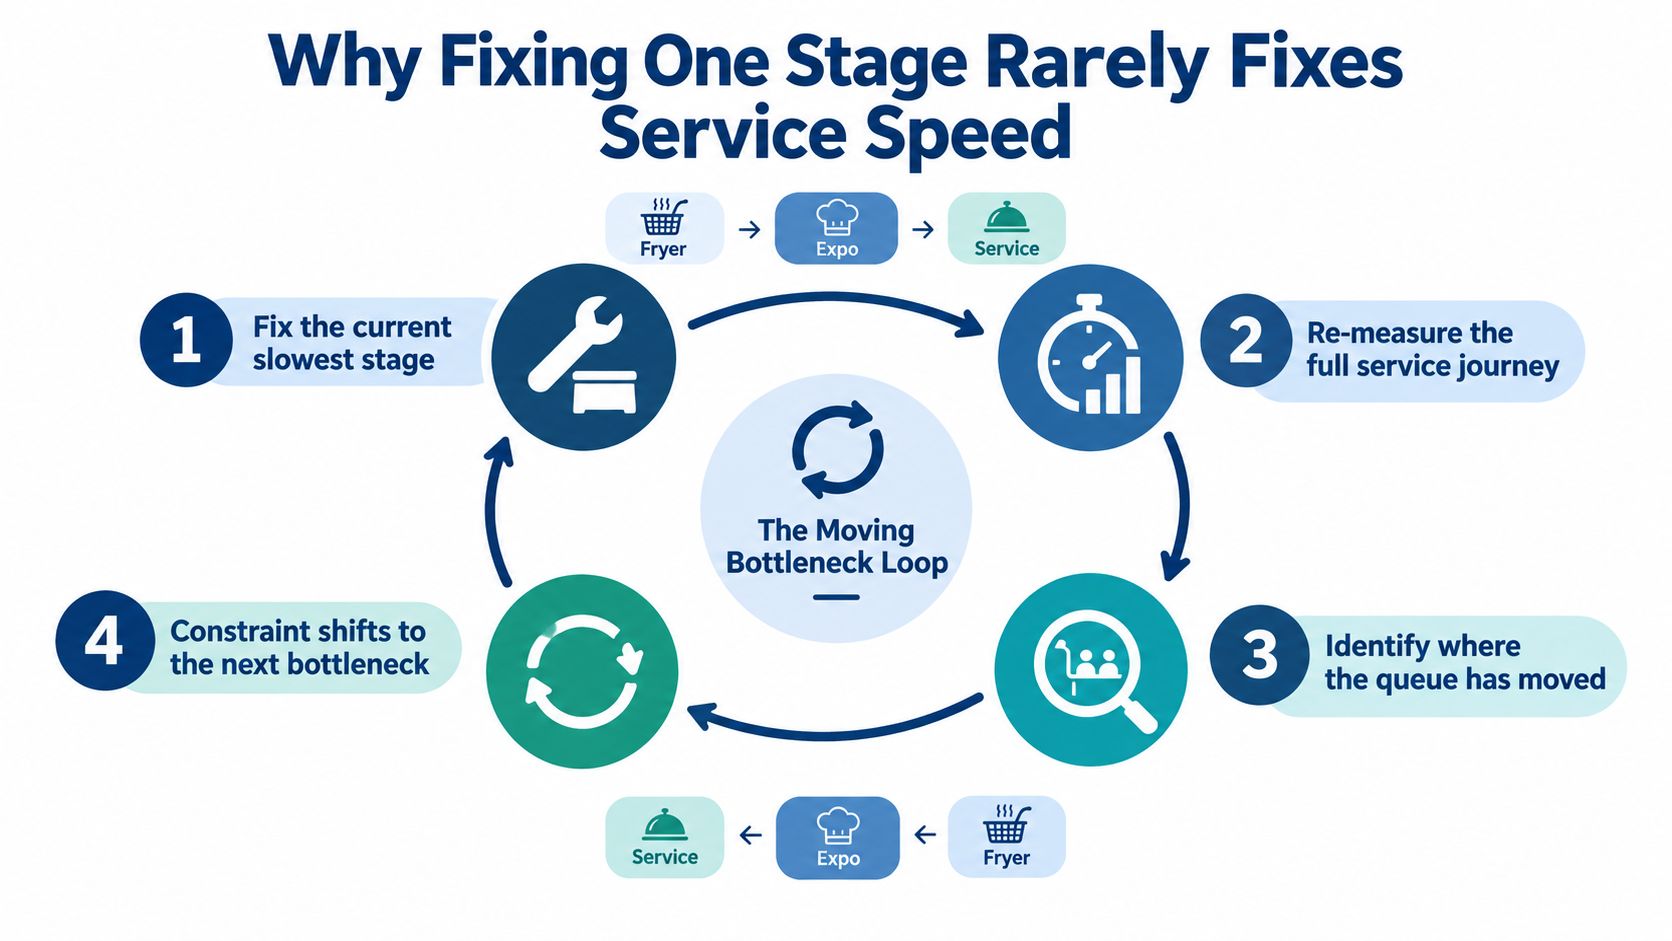
A simple example shows the trap. Say a café shortens drink prep by a minute per docket at the coffee station. During the rush, that sounds like a clear win. But if guests are still waiting on food, or if cleared tables are still sitting uncleared, the venue may serve the same number of covers in that hour. The queue has shifted. Capacity has not.
That is why single-point fixes often disappoint operators after the invoice is paid. The purchase was valid. The commercial result was limited because another stage became the cap straight away.
The bottleneck usually moves
In practice, the pattern looks like this:
- Improve the stage that is currently capping throughput
- Watch a live peak again
- Find the next stage where work starts waiting
- Decide whether removing that constraint is worth the spend
That last step matters. Not every bottleneck deserves fixing immediately. Some only show up on one service a week. Others are choking Friday lunch, Saturday dinner, and every function break. Those are very different buying decisions.
What that looks like on the floor
A few common patterns:
- Prep gets faster, but the grill stays full: tickets still wait because cook capacity has not changed.
- Cooking gets faster, but the pass clogs: food is ready earlier, then sits while plating or runners catch up.
- A bigger dishwasher goes in, but reset is still slow: crockery may wash faster, but tables do not turn faster if scraping, sorting, or getting racks back to the machine is messy.
- Ordering becomes quicker, but payment or clearing lags: guests enter the system faster than the venue can finish and reset the table.
The practical test is straightforward. Ask one question. Did this change let the venue serve more real demand in the period that was previously constrained?
Measure the whole chain, not the improved station
Operators make better calls when they judge a change across the full service path:
- order taken
- order sent correctly
- production started
- food or drinks finished
- pass or pickup cleared
- table served or customer handed off
- payment completed
- table cleared and ready again
One fast station inside a slow chain still leaves the chain slow.
I regularly see businesses buy equipment to fix the busiest-looking part of service, then wonder why revenue barely moves. Usually the answer is simple. The visible pressure point was not the stage preventing the next sale. Or it was, but only until the backlog moved one step downstream.
That is why re-measuring matters after every meaningful change. Service speed is a system capacity question, not a single appliance question.
Removing Constraints With Smarter Workflow and Equipment Choices
Once you know which stage is capping peak-period sales, the job is to remove that constraint with the least disruption and the clearest return. Sometimes that means changing the way the team works. Sometimes it means buying equipment. Quite often it means doing both in the right order.
A lot of operators buy speed where they can see pressure, not where they can gain capacity.
Equipment should solve a specific capacity limit
Equipment earns its keep when it increases output at the stage that is stopping you from serving demand. If the bottleneck sits in production, practical options might include:
- Underbench refrigeration near the line to cut repeated trips for ingredients
- Food processors where manual prep is chewing up labour before the rush starts
- Fryers sized for the actual menu mix, especially when a few high-volume items dominate peak orders
- Ovens that match real service throughput rather than nominal tray capacity
- Dishwashers suited to rack volume, pass-through flow, and table reset timing
- Dedicated bench space so prep, plating, and pass are not fighting for the same surface
The right choice depends on what demand looks like in your venue. A lunch-led cafe, a high-turn QSR site, and a full-service restaurant can all have "slow service" with three completely different causes. Footprint matters too. So does whether the constraint shows up every day or only on Friday night.
Workflow problems often get misdiagnosed as equipment problems
I see this regularly. A venue adds labour or swaps out a machine, service improves for a few days, then the same pressure comes back somewhere else.
The cause is often flow, not horsepower.
If staff cross over each other to reach garnish, crockery, or wash-up, extra output on paper does not translate into more covers served. If clean and dirty paths clash, or the pass is too tight for the volume being pushed through it, faster cooking can just create an earlier queue. Physical layout decisions shape service speed more than many operators expect.
For layout-led constraints, SACH Design is relevant because the fix may involve reworking bench positions, pass space, storage access, or traffic flow rather than replacing a single appliance.
Use return logic, not speed for its own sake
The useful question is simple. Will this change let the venue complete more real transactions in the period that currently sells out?
That calls for a basic commercial check:
- identify the stage that is limiting completed service
- confirm demand is waiting behind that stage during peak periods
- estimate how many extra orders, covers, or table turns the change could realistically allow
- compare that upside with purchase cost, install cost, labour effect, downtime risk, and space trade-offs
That last part matters. A larger oven may raise throughput but reduce bench space. More refrigeration near the line may save steps but tighten the pass. A bigger dishwasher may clear ware faster but still leave table reset slow if scraping and rack return are clumsy. Good decisions come from system impact, not catalogue specs.
For operators weighing upgrade choices, related reads include What Does One Hour of Kitchen Downtime Really Cost, Which Commercial Kitchen Upgrade Delivers the Fastest Return on Investment, and commercial kitchen design planning.
Hospitality helps operators work through these decisions with practical equipment, workflow, and fit-out advice across refrigeration, cooking, food prep, dishwashing, and kitchen design. If slow service is limiting what your venue can sell during peak periods, visit Simply Hospitality to compare options and get help choosing a solution that fits the way your business operates.